Technical Analysis of MMIT 2024-05-10
Overview:
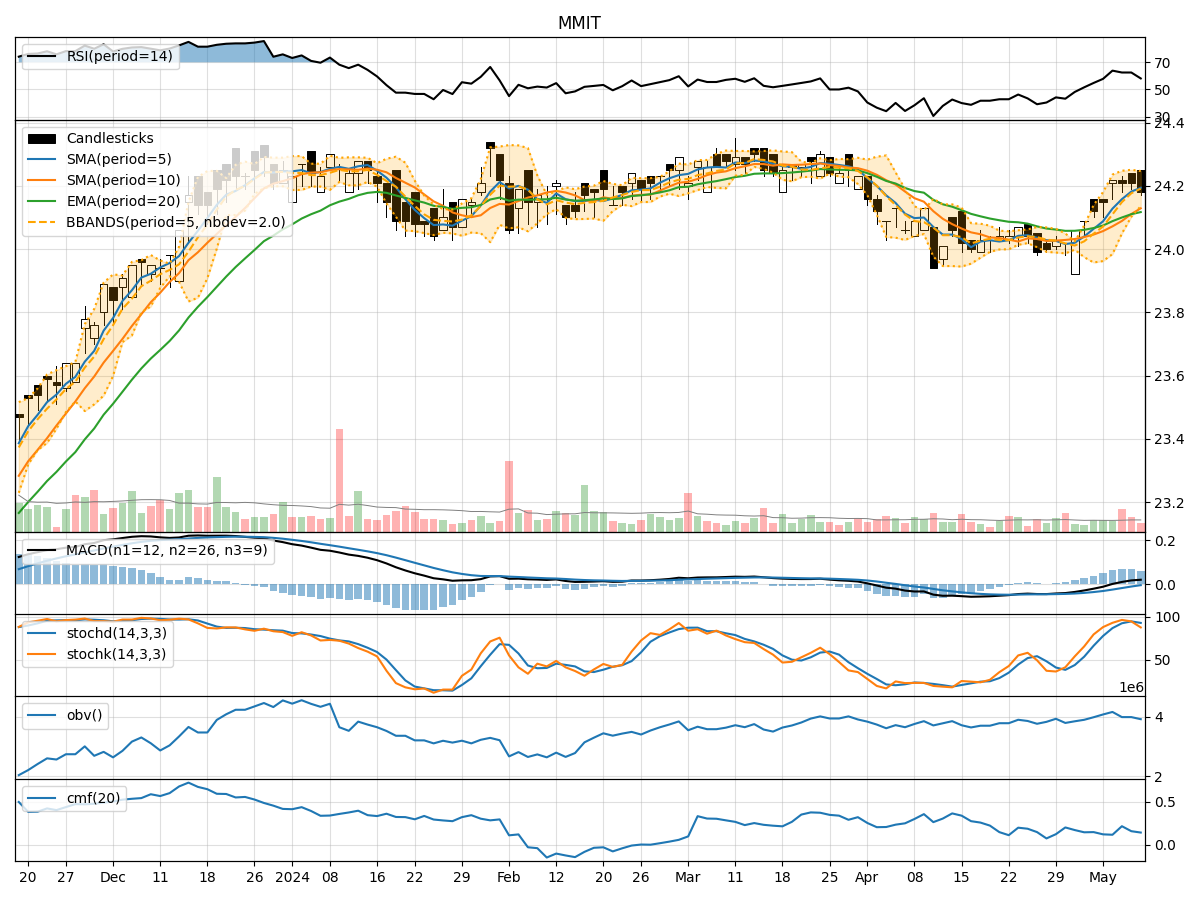
In analyzing the technical indicators for MMIT stock over the last 5 days, we will delve into the trends, momentum, volatility, and volume aspects to provide a comprehensive outlook on the possible stock price movement in the coming days. By examining key indicators such as moving averages, MACD, RSI, Bollinger Bands, and OBV, we aim to offer valuable insights and predictions for potential price action.
Trend Analysis:
- Moving Averages (MA): The 5-day MA has been consistently above the closing prices, indicating a short-term uptrend.
- MACD: The MACD line has been above the signal line, suggesting bullish momentum.
- EMA: The EMA has been trending upwards, supporting the bullish sentiment.
Key Observation: The trend indicators point towards an upward movement in the stock price.
Momentum Analysis:
- RSI: The RSI has been fluctuating around the overbought territory, indicating strong buying pressure.
- Stochastic Oscillator: Both %K and %D have been in the overbought zone, signaling potential overvaluation.
- Williams %R: The Williams %R has been consistently in the oversold region, suggesting a possible reversal.
Key Observation: Momentum indicators suggest a mixed sentiment with potential for a pullback due to overbought conditions.
Volatility Analysis:
- Bollinger Bands (BB): The stock price has been trading within the bands, indicating normal volatility.
- Bollinger Band Width: The band width has been narrowing, suggesting a decrease in volatility.
Key Observation: Volatility indicators imply a stable price movement with a potential for a breakout.
Volume Analysis:
- On-Balance Volume (OBV): The OBV has been relatively stable, indicating consistent buying interest.
- Chaikin Money Flow (CMF): The CMF has been positive, reflecting strong accumulation.
Key Observation: Volume indicators support the bullish sentiment with sustained buying pressure.
Conclusion:
Based on the analysis of trend, momentum, volatility, and volume indicators, the overall outlook for MMIT stock suggests a continued upward movement in the coming days. The trend indicators signal a bullish sentiment, supported by positive momentum and volume indicators. While there may be a potential for a short-term pullback due to overbought conditions, the overall trend remains bullish. Traders and investors can consider buying opportunities on dips for potential gains in the near term.