Technical Analysis of MSOX 2024-05-03
Overview:
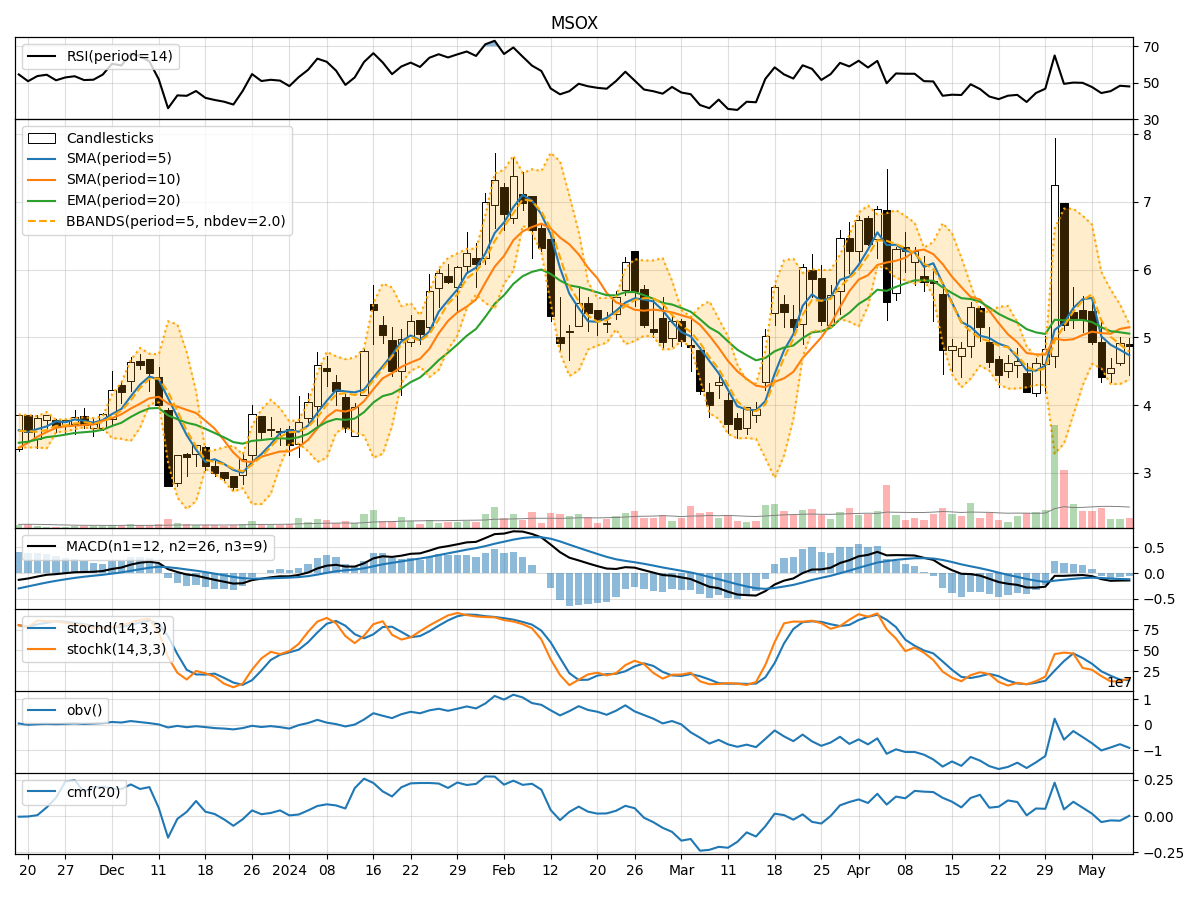
In analyzing the technical indicators for MSOX over the last 5 days, we will delve into the trend, momentum, volatility, and volume indicators to provide a comprehensive outlook on the possible stock price movement in the coming days.
Trend Analysis:
- Moving Averages (MA): The 5-day MA has been showing an upward trend, indicating a positive momentum in the short term.
- MACD: The MACD line has been consistently below the signal line, suggesting a bearish trend in the stock price movement.
- EMA: The EMA has been relatively stable, indicating a potential consolidation phase in the stock.
Momentum Analysis:
- RSI: The RSI has been hovering around the neutral zone, indicating a lack of strong momentum in either direction.
- Stochastic Oscillator: Both %K and %D have been fluctuating, reflecting indecision in the market.
- Williams %R: The Williams %R is in the oversold territory, suggesting a possible reversal in the stock price.
Volatility Analysis:
- Bollinger Bands (BB): The bands have been narrowing, indicating decreasing volatility and a potential breakout in the near future.
- BB %B: The %B indicator has been declining, signaling a possible decrease in volatility.
Volume Analysis:
- On-Balance Volume (OBV): The OBV has been fluctuating, indicating mixed sentiment among investors.
- Chaikin Money Flow (CMF): The CMF has been relatively low, suggesting a lack of strong buying or selling pressure.
Key Observations:
- The stock is currently in a consolidation phase, as indicated by the stable EMA and narrowing Bollinger Bands.
- Momentum indicators show mixed signals, with RSI and Stochastic Oscillator reflecting indecision in the market.
- Volatility is decreasing, which could lead to a breakout in the stock price.
- Volume indicators suggest a lack of strong buying or selling pressure.
Conclusion:
Based on the analysis of the technical indicators, the stock is likely to experience sideways movement in the coming days. The consolidation phase may continue, with a potential breakout on the horizon as volatility decreases. Investors should closely monitor key support and resistance levels for any potential trend reversal. It is advisable to wait for a clear signal from the indicators before making any significant trading decisions.