Technical Analysis of MUNI 2024-05-10
Overview:
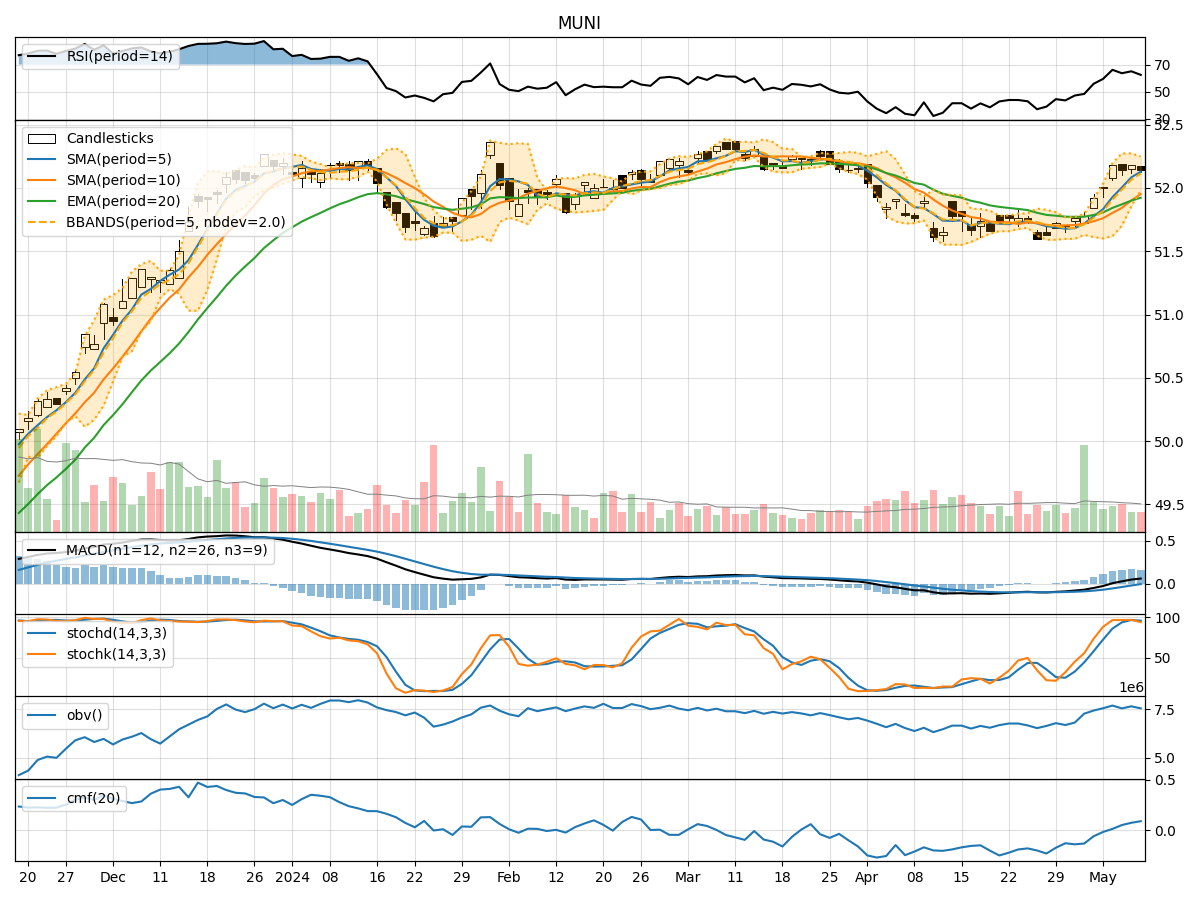
In analyzing the technical indicators for MUNI stock over the last 5 days, we will delve into the trend, momentum, volatility, and volume indicators to provide a comprehensive outlook on the possible stock price movement in the coming days.
Trend Analysis:
- Moving Averages (MA): The 5-day Moving Average (MA) has been consistently above the Simple Moving Average (SMA) and Exponential Moving Average (EMA), indicating a bullish trend.
- MACD: The MACD line has been consistently above the signal line, with both lines trending upwards, suggesting a bullish momentum.
Momentum Analysis:
- RSI: The Relative Strength Index (RSI) has been fluctuating around the 60-70 range, indicating a neutral momentum.
- Stochastic Oscillator: Both %K and %D have been in the overbought zone, suggesting a potential reversal or consolidation.
Volatility Analysis:
- Bollinger Bands (BB): The stock price has been trading within the Bollinger Bands, with the bands narrowing, indicating decreasing volatility.
Volume Analysis:
- On-Balance Volume (OBV): The OBV has shown mixed signals, with fluctuations in volume accumulation.
- Chaikin Money Flow (CMF): The CMF has been positive, indicating buying pressure in the stock.
Key Observations:
- The trend indicators suggest a bullish sentiment in the short term.
- Momentum indicators show a neutral stance with a potential for a reversal.
- Volatility has been decreasing, indicating a possible period of consolidation.
- Volume indicators reflect mixed signals with some buying pressure.
Conclusion:
Based on the analysis of the technical indicators, the next few days for MUNI stock could see sideways movement with a slight bullish bias. Traders should watch for potential reversals indicated by the Stochastic Oscillator and monitor volume accumulation for confirmation of the trend. It is advisable to exercise caution and wait for clearer signals before making significant trading decisions.