Technical Analysis of NAIL 2024-05-10
Overview:
In analyzing the technical indicators for NAIL over the last 5 days, we will delve into the trend, momentum, volatility, and volume indicators to provide a comprehensive outlook on the possible stock price movement in the coming days. By examining these key aspects, we aim to offer valuable insights and recommendations for potential trading strategies.
Trend Indicators:
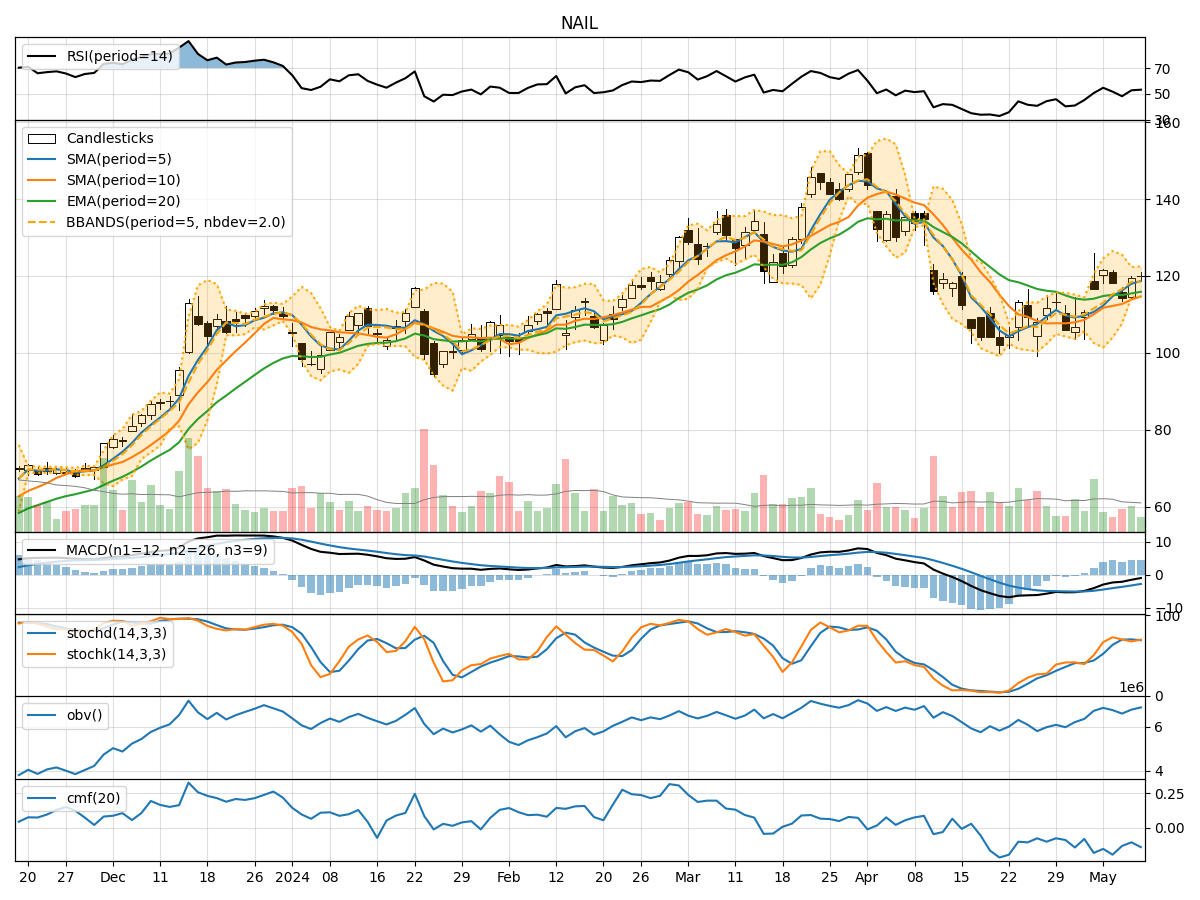
- Moving Averages (MA): The 5-day moving average has been consistently above the longer-term moving averages (SMA and EMA), indicating a short-term uptrend.
- MACD: The MACD line has been gradually improving, moving closer to the signal line, suggesting a potential bullish crossover.
- MACD Histogram: The histogram has been showing a positive trend, indicating increasing bullish momentum.
Momentum Indicators:
- RSI: The RSI has been fluctuating around the neutral 50 level, indicating a lack of strong momentum in either direction.
- Stochastic Oscillator: Both %K and %D have been hovering in the overbought territory, suggesting a potential reversal or consolidation.
- Williams %R: The indicator has been oscillating in the oversold region, indicating a possible buying opportunity.
Volatility Indicators:
- Bollinger Bands: The bands have been narrowing, indicating decreasing volatility and a potential period of consolidation.
- Bollinger %B: The %B indicator has been hovering around the middle range, suggesting a balanced market sentiment.
Volume Indicators:
- On-Balance Volume (OBV): The OBV has been relatively stable, indicating a neutral volume flow.
- Chaikin Money Flow (CMF): The CMF has been negative, suggesting a slight distribution phase.
Key Observations and Opinions:
- Trend: The short-term trend is bullish, supported by the moving averages and MACD indicators.
- Momentum: The momentum indicators are mixed, with RSI neutral, Stochastic overbought, and Williams %R oversold, indicating a potential period of consolidation.
- Volatility: Volatility is decreasing, as shown by the narrowing Bollinger Bands, signaling a potential sideways movement.
- Volume: Volume indicators suggest a lack of significant buying or selling pressure, leading to a neutral volume outlook.
Conclusion:
Based on the analysis of the technical indicators, the next few days for NAIL are likely to see sideways movement with a potential consolidation phase. Traders may consider adopting a wait-and-see approach until clearer signals emerge. It is crucial to monitor key levels such as support and resistance for potential breakout opportunities. Exercise caution in trading during this period of uncertainty and be prepared to adapt to changing market conditions.