Technical Analysis of NCPB 2024-05-10
Overview:
In analyzing the technical indicators for NCPB over the last 5 days, we will delve into the trend, momentum, volatility, and volume indicators to provide a comprehensive outlook on the possible stock price movement in the coming days. By examining these key aspects, we aim to offer valuable insights and predictions to guide your investment decisions.
Trend Indicators:
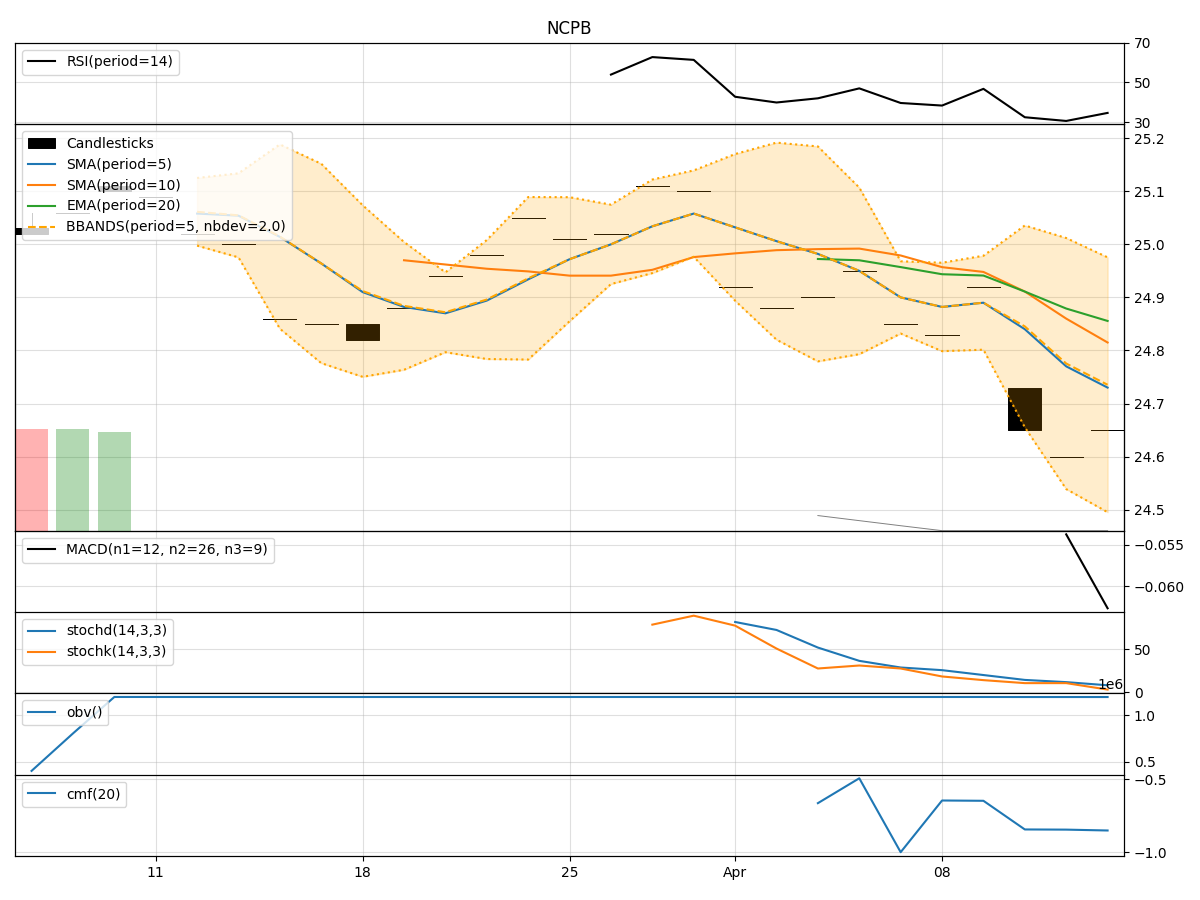
- Moving Averages (MA): The 5-day MA has been consistently above the closing prices, indicating a short-term uptrend.
- MACD: The MACD line has been positive, suggesting bullish momentum.
- RSI: The RSI values have been fluctuating around the neutral zone, indicating indecision in the market sentiment.
Momentum Indicators:
- Stochastic Oscillator: The stochastic indicators have been gradually decreasing, signaling a potential reversal in momentum.
- Williams %R: The Williams %R values have been negative, indicating an oversold condition.
Volatility Indicators:
- Bollinger Bands: The stock price has been trading within the Bollinger Bands, suggesting a period of consolidation.
- Volatility: The volatility has been relatively low, indicating a lack of significant price movements.
Volume Indicators:
- On-Balance Volume (OBV): The OBV has been relatively flat, indicating a balance between buying and selling pressure.
- Chaikin Money Flow (CMF): The CMF has been negative, suggesting outflows from the stock.
Key Observations:
- The trend indicators show a bullish bias with positive MACD and MA values.
- Momentum indicators suggest a potential shift in momentum towards a bearish direction.
- Volatility indicators point towards a period of consolidation with low volatility.
- Volume indicators indicate a balance between buying and selling pressure with a negative CMF.
Conclusion:
Based on the analysis of the technical indicators, the next few days for NCPB stock price movement are likely to be sideways with a slight bearish bias. The bullish trend indicated by moving averages and MACD may face resistance due to the weakening momentum and negative stochastic indicators. The low volatility and balanced volume further support the expectation of a sideways movement. Investors should exercise caution and consider potential downside risks in their trading strategies.