Technical Analysis of NEAR 2024-05-10
Overview:
In analyzing the technical indicators for NEAR stock over the last 5 days, we will delve into the trend, momentum, volatility, and volume indicators to provide a comprehensive outlook on the possible stock price movement in the coming days.
Trend Analysis:
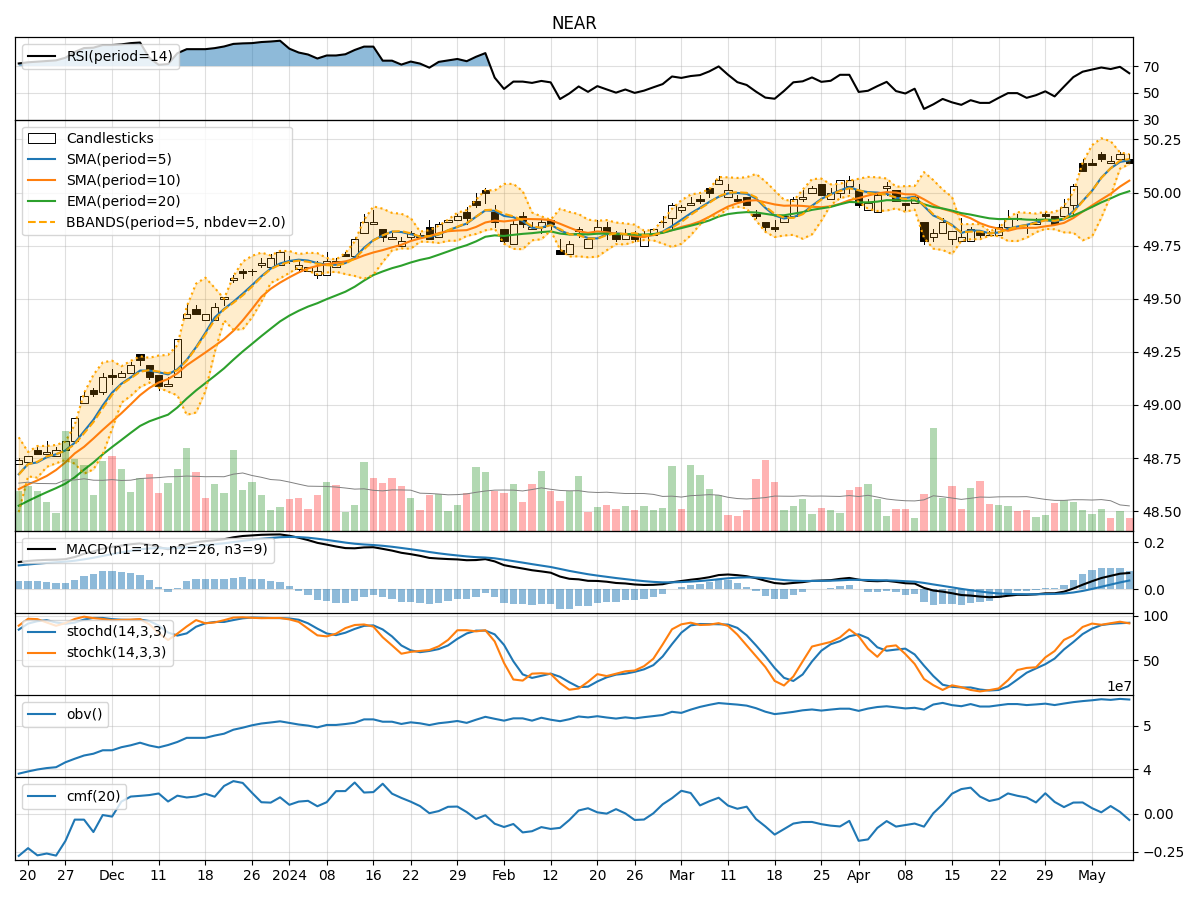
- Moving Averages (MA): The 5-day Moving Average (MA) has been consistently above the Simple Moving Average (SMA) and Exponential Moving Average (EMA), indicating a bullish trend.
- MACD: The MACD line has been consistently above the signal line, with both lines showing an upward trend, suggesting bullish momentum.
Momentum Analysis:
- RSI: The Relative Strength Index (RSI) has been fluctuating around 70, indicating a neutral to slightly overbought condition.
- Stochastic Oscillator: Both %K and %D lines of the Stochastic Oscillator have been in the overbought zone, signaling a potential reversal or consolidation.
Volatility Analysis:
- Bollinger Bands (BB): The stock price has been trading within the Bollinger Bands, with the bands narrowing, suggesting a decrease in volatility.
Volume Analysis:
- On-Balance Volume (OBV): The OBV has been fluctuating, indicating indecision among investors.
- Chaikin Money Flow (CMF): The CMF has been positive but trending downwards, suggesting a potential decrease in buying pressure.
Key Observations:
- The trend indicators point towards a bullish sentiment in the short term.
- Momentum indicators show a potential overbought condition, signaling a need for caution.
- Volatility has been decreasing, indicating a possible period of consolidation.
- Volume indicators reflect mixed signals, with no clear direction in investor sentiment.
Conclusion:
Based on the analysis of the technical indicators, the next few days for NEAR stock could see sideways movement or consolidation. While the trend remains bullish, the overbought momentum and decreasing volatility suggest a potential period of stabilization in the stock price. Investors should closely monitor key support and resistance levels for potential entry or exit points.