Technical Analysis of NIKL 2024-05-31
Overview:
In analyzing the technical indicators for NIKL over the last 5 days, we will delve into the trend, momentum, volatility, and volume indicators to provide a comprehensive outlook on the possible stock price movement in the coming days. By examining these key indicators, we aim to offer valuable insights and predictions for potential investors.
Trend Analysis:
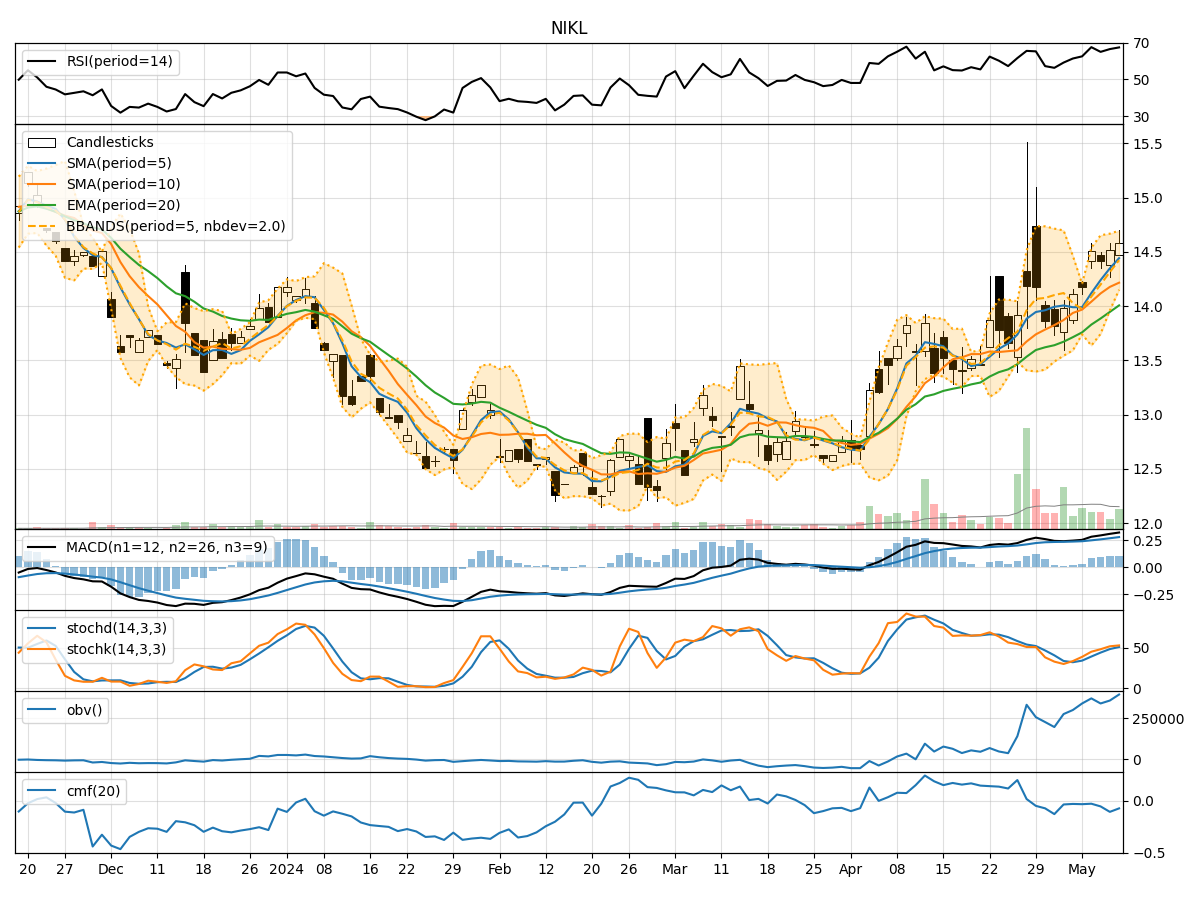
- Moving Averages (MA): The 5-day Moving Average (MA) has been fluctuating around the closing prices, indicating a lack of clear trend direction.
- MACD: The Moving Average Convergence Divergence (MACD) has shown slight positive values, suggesting a potential bullish momentum.
- EMA: The Exponential Moving Average (EMA) has been gradually increasing, indicating a positive trend in the stock price.
Momentum Analysis:
- RSI: The Relative Strength Index (RSI) has been hovering around the neutral zone, indicating a balanced momentum.
- Stochastic Oscillator: The Stochastic Oscillator reflects mixed signals with fluctuations in the %K and %D values.
- Williams %R: The Williams %R indicator has shown oversold conditions but without a clear trend direction.
Volatility Analysis:
- Bollinger Bands (BB): The Bollinger Bands have shown narrowing bands, suggesting decreasing volatility in the stock price.
- BB% (Bollinger Band %B): The %B indicator has been fluctuating within a narrow range, indicating a consolidation phase.
- Average True Range (ATR): The ATR values have been relatively stable, indicating consistent price movements.
Volume Analysis:
- On-Balance Volume (OBV): The OBV indicator has shown mixed volume accumulation, without a clear trend direction.
- Chaikin Money Flow (CMF): The CMF has been negative, indicating potential selling pressure in the stock.
Key Observations:
- The trend indicators suggest a potential bullish bias with the EMA showing an upward trend.
- Momentum indicators reflect a neutral stance with no clear indication of strong buying or selling pressure.
- Volatility indicators point towards decreasing volatility and a possible consolidation phase.
- Volume indicators show mixed signals with no definitive trend in volume accumulation.
Conclusion:
Based on the analysis of the technical indicators, the next few days for NIKL stock price movement could be sideways or consolidation. The lack of clear trends in momentum, volume, and volatility, coupled with the mixed signals from various indicators, indicates a period of indecision in the market. Investors may expect the stock price to trade within a range without significant directional bias. It is advisable to closely monitor the key indicators for any potential shifts in market sentiment before making investment decisions.