Technical Analysis of NRGD 2024-05-03
Overview:
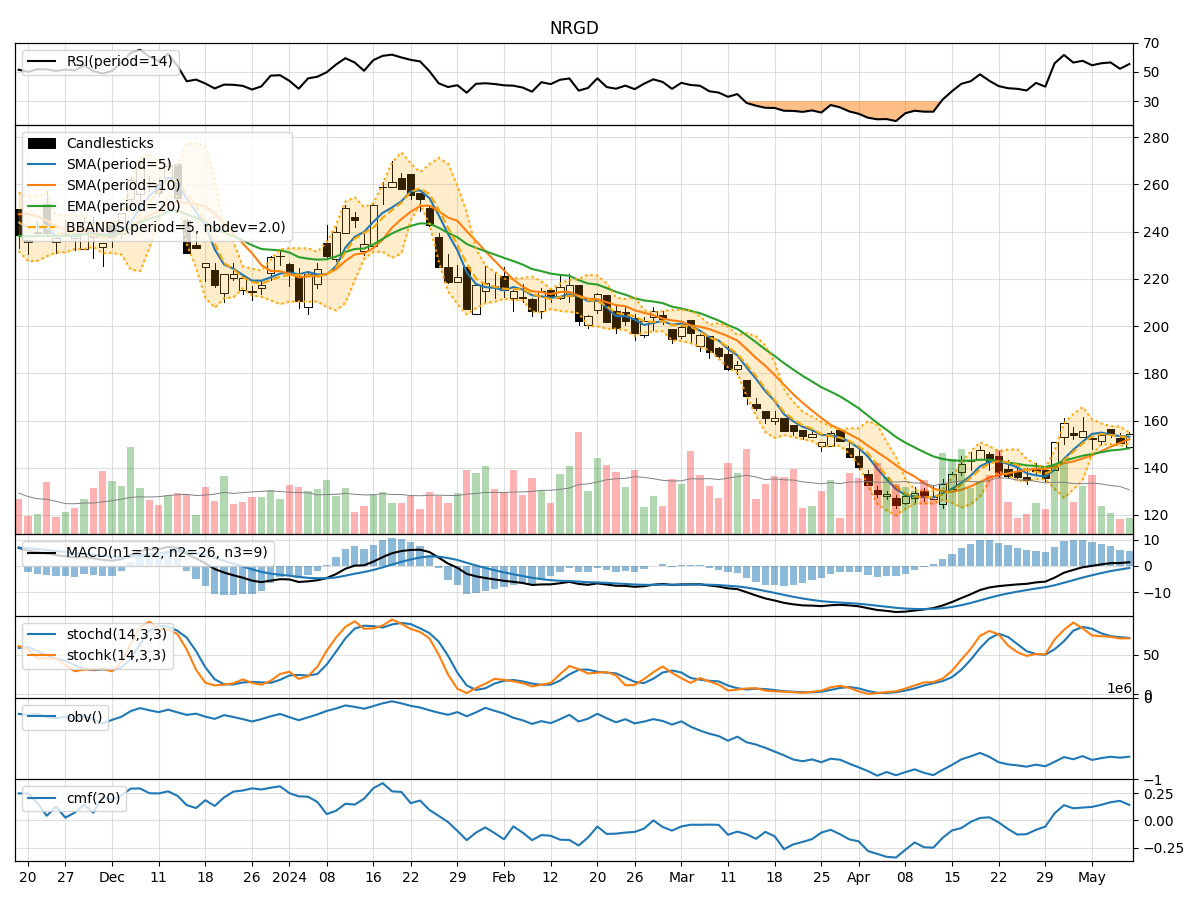
In analyzing the technical indicators for NRGD over the last 5 days, we will delve into the trend, momentum, volatility, and volume indicators to provide a comprehensive outlook on the possible stock price movement in the coming days. By examining these key indicators, we aim to offer valuable insights and predictions for informed decision-making.
Trend Indicators:
- Moving Averages (MA): The 5-day MA has been below the closing price, indicating a short-term bearish trend.
- MACD: The MACD has been negative but showing signs of convergence, suggesting a potential reversal in the bearish momentum.
- EMA: The EMA has been declining but may stabilize soon.
Momentum Indicators:
- RSI: The RSI has been fluctuating around the neutral zone, indicating indecision in the market.
- Stochastic Oscillator: Both %K and %D have been in overbought territory, signaling a potential reversal.
- Williams %R: The indicator has been in oversold territory, suggesting a possible buying opportunity.
Volatility Indicators:
- Bollinger Bands (BB): The bands have been widening, indicating increased volatility in the stock price.
- BB %B: The %B has been fluctuating, suggesting potential price reversals.
- BB Width: The width of the bands has been expanding, indicating heightened volatility.
Volume Indicators:
- On-Balance Volume (OBV): The OBV has been declining, indicating selling pressure in the stock.
- Chaikin Money Flow (CMF): The CMF has been positive, suggesting buying pressure in the market.
Key Observations and Opinions:
- Trend: The stock has been in a short-term bearish trend, but there are signs of a potential reversal in the MACD.
- Momentum: The momentum indicators are mixed, with RSI showing indecision, Stochastic indicating a potential reversal, and Williams %R suggesting a buying opportunity.
- Volatility: Volatility has been increasing, as seen in the widening Bollinger Bands, which could lead to sharp price movements.
- Volume: The OBV is declining, indicating selling pressure, while the CMF suggests some buying interest.
Conclusion:
Based on the analysis of the technical indicators, the stock price of NRGD may experience further downside movement in the short term due to the bearish trend and selling pressure indicated by the OBV. However, the potential convergence in the MACD and the oversold condition in the Williams %R could lead to a temporary price reversal or consolidation. Traders should exercise caution and closely monitor the MACD for a potential bullish crossover as a signal to consider long positions. Overall, the outlook for NRGD remains cautiously bearish in the near future.