Technical Analysis of NRGU 2024-05-10
Overview:
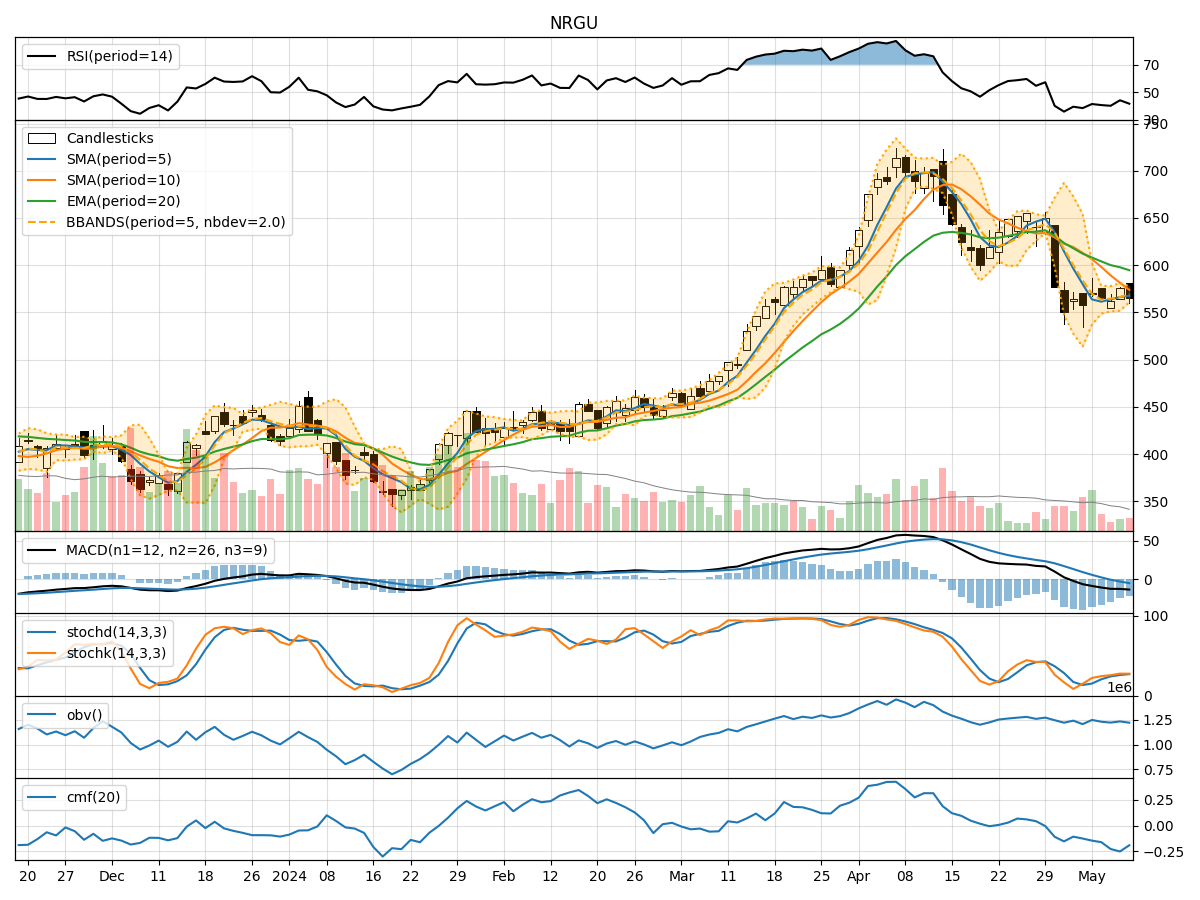
In analyzing the technical indicators for NRGU over the last 5 days, we will delve into the trend, momentum, volatility, and volume indicators to provide a comprehensive outlook on the possible stock price movement in the coming days.
Trend Analysis:
- Moving Averages (MA): The 5-day MA has been fluctuating around the 563-567 range, indicating a relatively stable trend in the short term.
- MACD: The MACD has been consistently negative, suggesting a bearish momentum in the stock price.
- EMA: The EMA has been gradually declining, further supporting the bearish sentiment in the short to medium term.
Momentum Analysis:
- RSI: The RSI has been hovering around 40-44, indicating a neutral to slightly bearish momentum.
- Stochastic Oscillator: Both %K and %D have been relatively low, suggesting a lack of strong buying pressure.
- Williams %R: The Williams %R is in the oversold territory, indicating a potential reversal or consolidation phase.
Volatility Analysis:
- Bollinger Bands (BB): The stock price has been trading within the lower Bollinger Band, indicating a potential oversold condition.
- Bollinger Band Width: The BB Width has been narrowing, suggesting a decrease in volatility and a possible period of consolidation.
Volume Analysis:
- On-Balance Volume (OBV): The OBV has been declining, indicating a decrease in buying volume.
- Chaikin Money Flow (CMF): The CMF has been negative, reflecting a lack of buying pressure and potential distribution.
Key Observations:
- The trend indicators suggest a bearish sentiment in the short to medium term.
- Momentum indicators indicate a neutral to slightly bearish momentum.
- Volatility indicators point towards a potential period of consolidation.
- Volume indicators show a decrease in buying volume and lack of strong buying pressure.
Conclusion:
Based on the analysis of the technical indicators, the next few days' possible stock price movement for NRGU is likely to be sideways with a slight bearish bias. Traders should exercise caution and monitor key support and resistance levels for potential entry or exit points. It is advisable to wait for clearer signals or confirmation of a trend reversal before making significant trading decisions.