Technical Analysis of NUMG 2024-05-10
Overview:
In analyzing the technical indicators for NUMG over the last 5 days, we will delve into the trend, momentum, volatility, and volume indicators to provide a comprehensive outlook on the possible stock price movement in the coming days. By examining these key aspects, we aim to offer valuable insights and predictions for informed decision-making.
Trend Analysis:
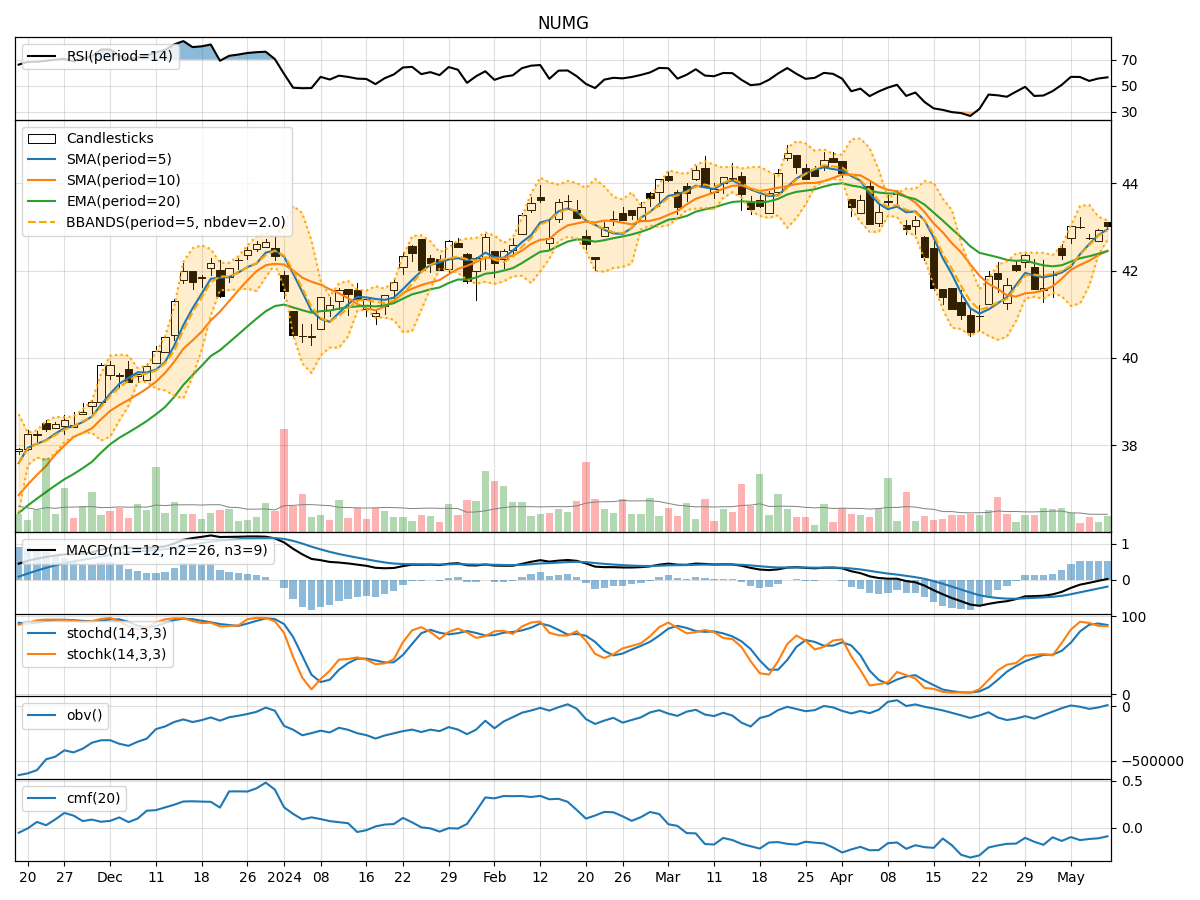
- Moving Averages (MA): The 5-day MA has been consistently above the closing prices, indicating a short-term uptrend.
- MACD: The MACD line has been positive, suggesting bullish momentum.
- RSI: The RSI values have been fluctuating around the 50 level, indicating a neutral stance.
Momentum Analysis:
- Stochastic Oscillator: Both %K and %D have been in the overbought zone, signaling a potential reversal.
- Williams %R: The indicator has been hovering around oversold levels, suggesting a possible buying opportunity.
Volatility Analysis:
- Bollinger Bands (BB): The bands have been narrowing, indicating decreasing volatility.
- BB %B: The %B value has been increasing, suggesting a potential breakout.
Volume Analysis:
- On-Balance Volume (OBV): The OBV has shown mixed signals, reflecting indecision among market participants.
- Chaikin Money Flow (CMF): The CMF has been negative, indicating selling pressure.
Key Observations:
- The trend indicators suggest a bullish bias in the short term.
- Momentum indicators point towards a potential reversal in the overbought territory.
- Volatility indicators indicate a possible breakout scenario.
- Volume indicators reflect mixed signals with a slight bearish bias.
Conclusion:
Based on the analysis of the technical indicators, the next few days' possible stock price movement for NUMG is likely to be sideways with a slight bearish bias. Traders should exercise caution as the stock may experience a period of consolidation before a potential breakout. It is advisable to closely monitor key support and resistance levels for confirmation of the anticipated price action.