Technical Analysis of NUSA 2024-05-10
Overview:
In analyzing the technical indicators for NUSA stock over the last 5 days, we will delve into the trend, momentum, volatility, and volume indicators to provide a comprehensive outlook on the possible future stock price movement. By examining these key indicators, we aim to offer valuable insights and predictions for the upcoming trading days.
Trend Analysis:
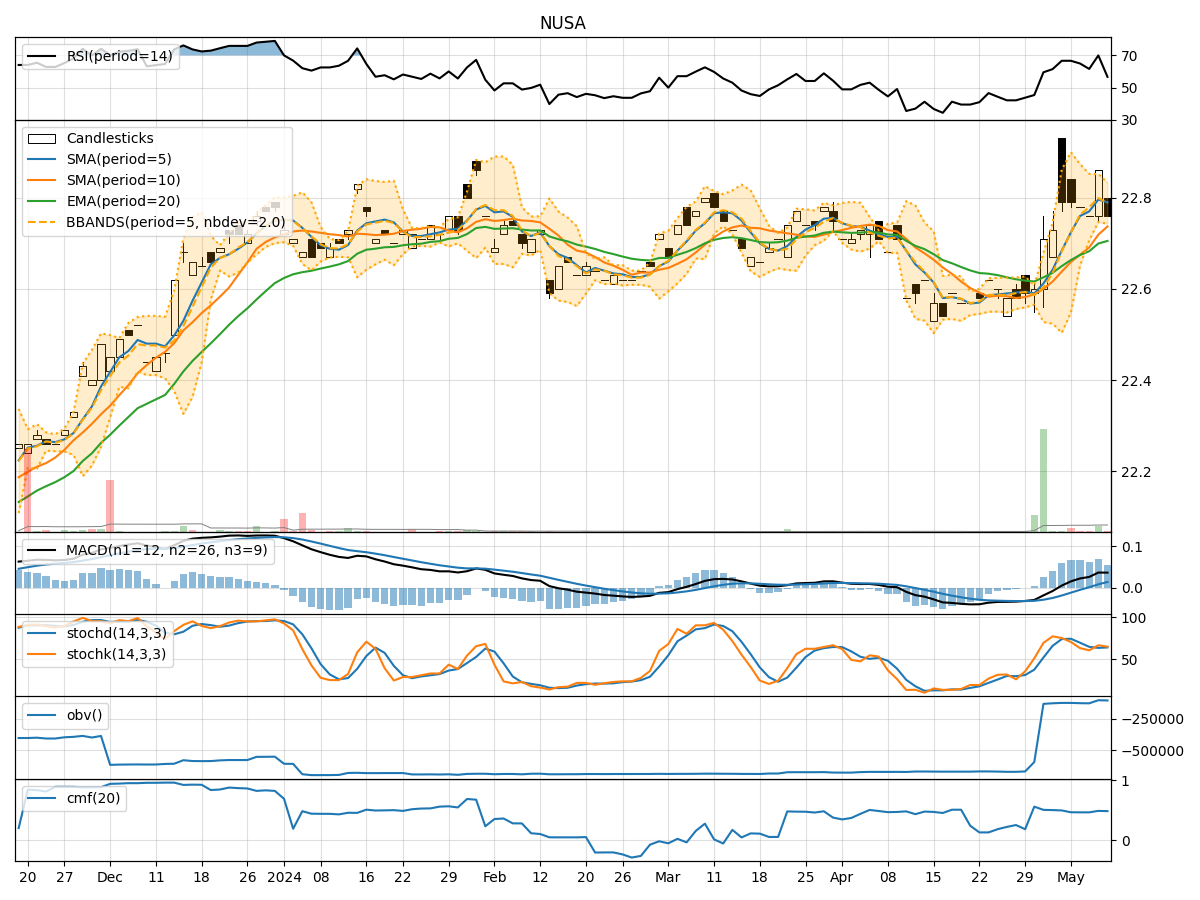
- Moving Averages (MA): The 5-day Moving Average (MA) has been relatively stable around the current stock price, indicating a neutral trend.
- MACD: The MACD line has shown a slight positive divergence, suggesting a potential bullish momentum.
- RSI: The Relative Strength Index (RSI) has fluctuated within the neutral range, indicating a lack of strong directional bias.
Key Observation: The trend indicators suggest a neutral to slightly bullish sentiment in the short term.
Momentum Analysis:
- Stochastic Oscillator: The Stochastic Oscillator has been oscillating near the oversold territory, indicating a potential reversal in momentum.
- Williams %R (WillR): The Williams %R has been hovering in the oversold region, signaling a possible buying opportunity.
Key Observation: Momentum indicators point towards a potential reversal in the current downtrend.
Volatility Analysis:
- Bollinger Bands (BB): The Bollinger Bands have shown a narrowing of the bands, indicating decreasing volatility.
- Bollinger %B (BBP): The Bollinger %B is currently below 0.5, suggesting a potential oversold condition.
Key Observation: Volatility indicators signal a period of consolidation or a potential reversal in price direction.
Volume Analysis:
- On-Balance Volume (OBV): The OBV has shown a slight increase, indicating accumulation by investors.
- Chaikin Money Flow (CMF): The CMF has been positive, reflecting buying pressure in the stock.
Key Observation: Volume indicators support the bullish sentiment in the short term.
Conclusion:
Based on the analysis of the technical indicators, the next few days for NUSA stock are likely to see a bullish movement. The convergence of positive signals from trend, momentum, volatility, and volume indicators suggests a potential uptrend in the stock price. Traders and investors may consider taking long positions or holding onto existing positions to capitalize on the expected price appreciation. However, it is essential to monitor the indicators closely for any signs of reversal or trend exhaustion.