Technical Analysis of OVB 2024-05-10
Overview:
In analyzing the provided technical indicators for the last 5 days, we will delve into the trend, momentum, volatility, and volume indicators to gain a comprehensive understanding of the stock's potential price movement. By examining these key factors, we aim to provide a well-informed prediction for the next few days.
Trend Indicators:
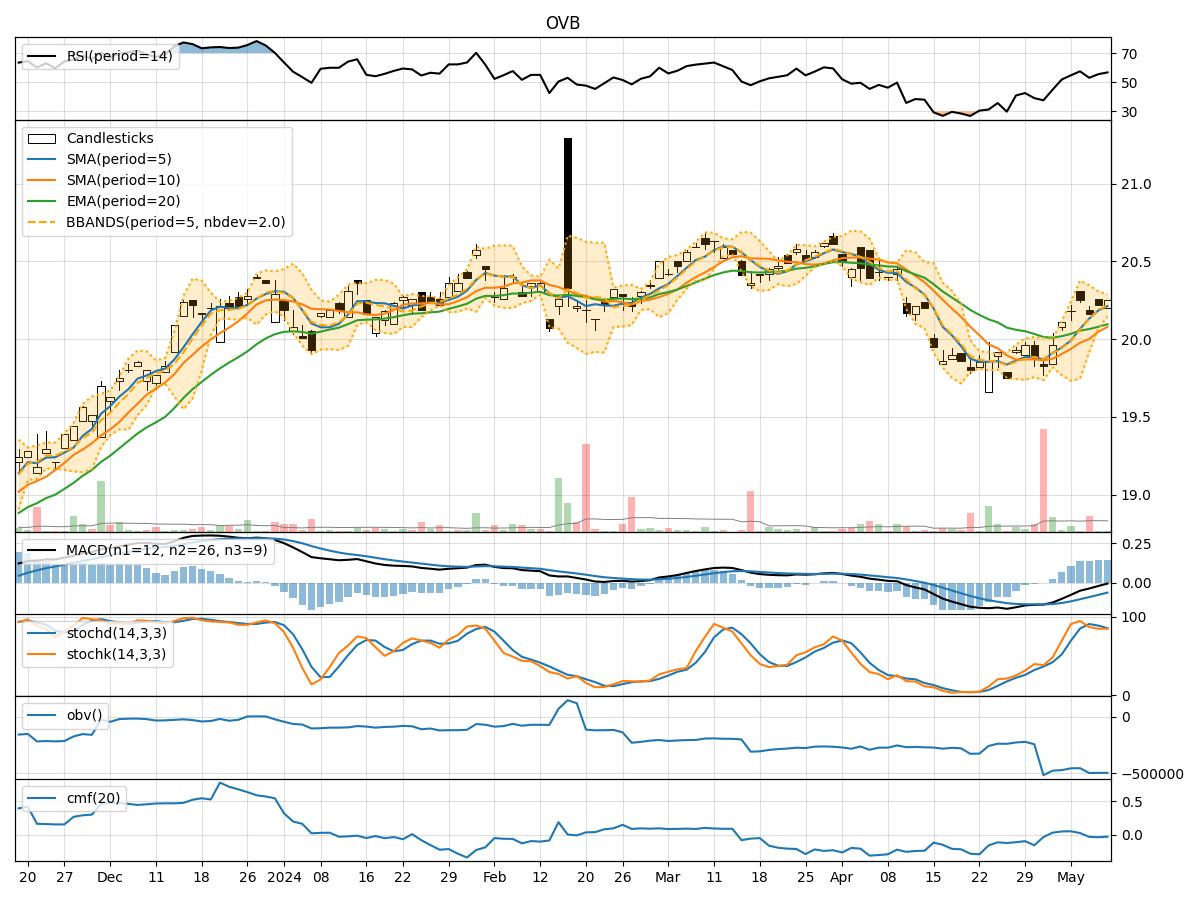
- Moving Averages (MA): The 5-day moving average has been consistently above the simple moving average (SMA) and exponential moving average (EMA), indicating a short-term uptrend.
- MACD: The MACD line has been negative but trending upwards, while the MACD histogram has been increasing, suggesting a potential bullish momentum.
Momentum Indicators:
- RSI: The Relative Strength Index (RSI) has been fluctuating around the neutral level of 50, indicating a balanced momentum.
- Stochastic Oscillator: Both %K and %D have been in the overbought region, signaling a potential reversal or consolidation.
Volatility Indicators:
- Bollinger Bands: The stock price has been trading within the Bollinger Bands, with the bands narrowing, indicating decreasing volatility.
Volume Indicators:
- On-Balance Volume (OBV): The OBV has been declining, suggesting a divergence between price and volume.
- Chaikin Money Flow (CMF): The CMF has been negative, indicating selling pressure in the market.
Key Observations:
- The trend indicators suggest a short-term uptrend, supported by the moving averages and MACD.
- Momentum indicators show mixed signals, with RSI hovering around the neutral level and stochastic oscillators in the overbought region.
- Volatility has been decreasing, as indicated by the narrowing Bollinger Bands.
- Volume indicators reflect a divergence between price and volume, with selling pressure evident in the market.
Conclusion:
Based on the analysis of the technical indicators, the stock is likely to experience sideways consolidation in the next few days. The mixed signals from momentum indicators, coupled with decreasing volatility and negative volume indicators, suggest a lack of clear direction in the near term. Traders may expect the stock price to trade within a range with no significant upward or downward movement. It is advisable to closely monitor the price action and wait for clearer signals before making any trading decisions.