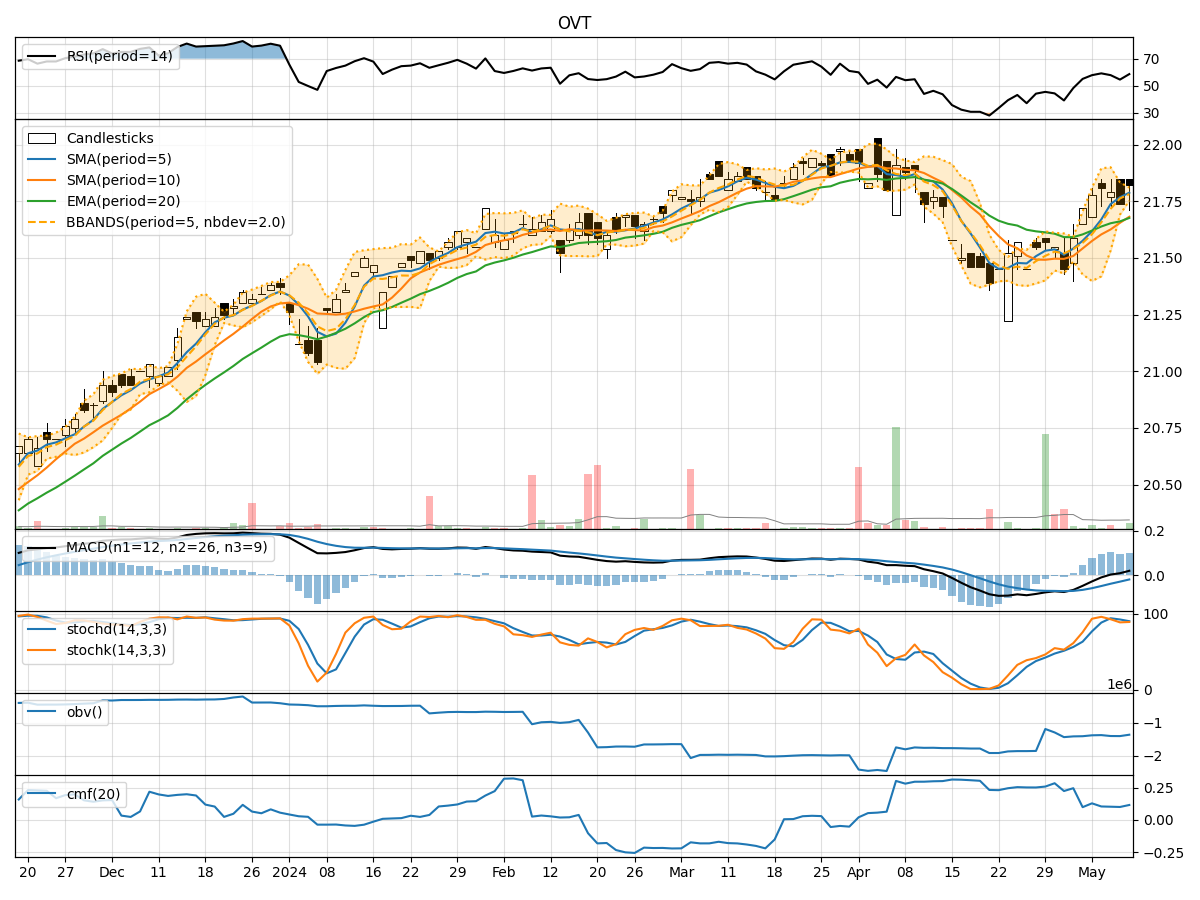
Technical Analysis of OVT 2024-05-10
Overview:
In analyzing the technical indicators for OVT stock over the last 5 days, we will delve into the trend, momentum, volatility, and volume indicators to provide a comprehensive outlook on the possible stock price movement in the coming days.
Trend Analysis:
- Moving Averages (MA): The 5-day Moving Average (MA) has been consistently above the Simple Moving Average (SMA) and Exponential Moving Average (EMA), indicating a bullish trend.
- MACD: The MACD line has been consistently above the signal line, with both lines showing an upward trend, suggesting bullish momentum.
- MACD Histogram: The MACD Histogram has been increasing over the past 5 days, indicating strengthening bullish momentum.
Momentum Analysis:
- RSI: The Relative Strength Index (RSI) has been fluctuating around the 50 level, indicating a neutral momentum.
- Stochastic Oscillator: Both %K and %D lines of the Stochastic Oscillator have been fluctuating, showing indecision in momentum.
- Williams %R: The Williams %R has been oscillating near the oversold territory, suggesting a potential reversal in momentum.
Volatility Analysis:
- Bollinger Bands (BB): The stock price has been trading within the Bollinger Bands, with the bands narrowing, indicating decreasing volatility.
- Bollinger %B: The %B indicator has been fluctuating around the midline, reflecting a neutral volatility sentiment.
Volume Analysis:
- On-Balance Volume (OBV): The OBV has shown mixed signals, with fluctuations in volume accumulation.
- Chaikin Money Flow (CMF): The CMF has been relatively stable around the neutral level, indicating balanced buying and selling pressure.
Key Observations:
- The trend indicators suggest a strong bullish sentiment, supported by the moving averages and MACD.
- Momentum indicators show mixed signals, with RSI indicating neutrality and Stochastic Oscillator signaling indecision.
- Volatility has been decreasing, as seen in the narrowing Bollinger Bands.
- Volume indicators reflect mixed signals, with OBV showing fluctuations and CMF indicating a balanced market sentiment.
Conclusion:
Based on the analysis of the technical indicators, the stock is likely to continue its upward trend in the next few days. The bullish trend supported by moving averages and MACD suggests a positive outlook. However, caution is advised due to mixed signals in momentum indicators and fluctuating volume. Traders should closely monitor key support and resistance levels for potential entry and exit points.
Recommendation:
- Long-Term Investors: Hold positions with a bullish bias, considering the strong trend indicators.
- Short-Term Traders: Exercise caution and wait for clearer signals from momentum indicators before entering new positions.
- Risk Management: Set stop-loss orders to protect gains and mitigate potential losses in case of a trend reversal.
In summary, the overall technical outlook for OVT stock is bullish, with a potential for further upside movement in the coming days.