Technical Analysis of PALL 2024-05-10
Overview:
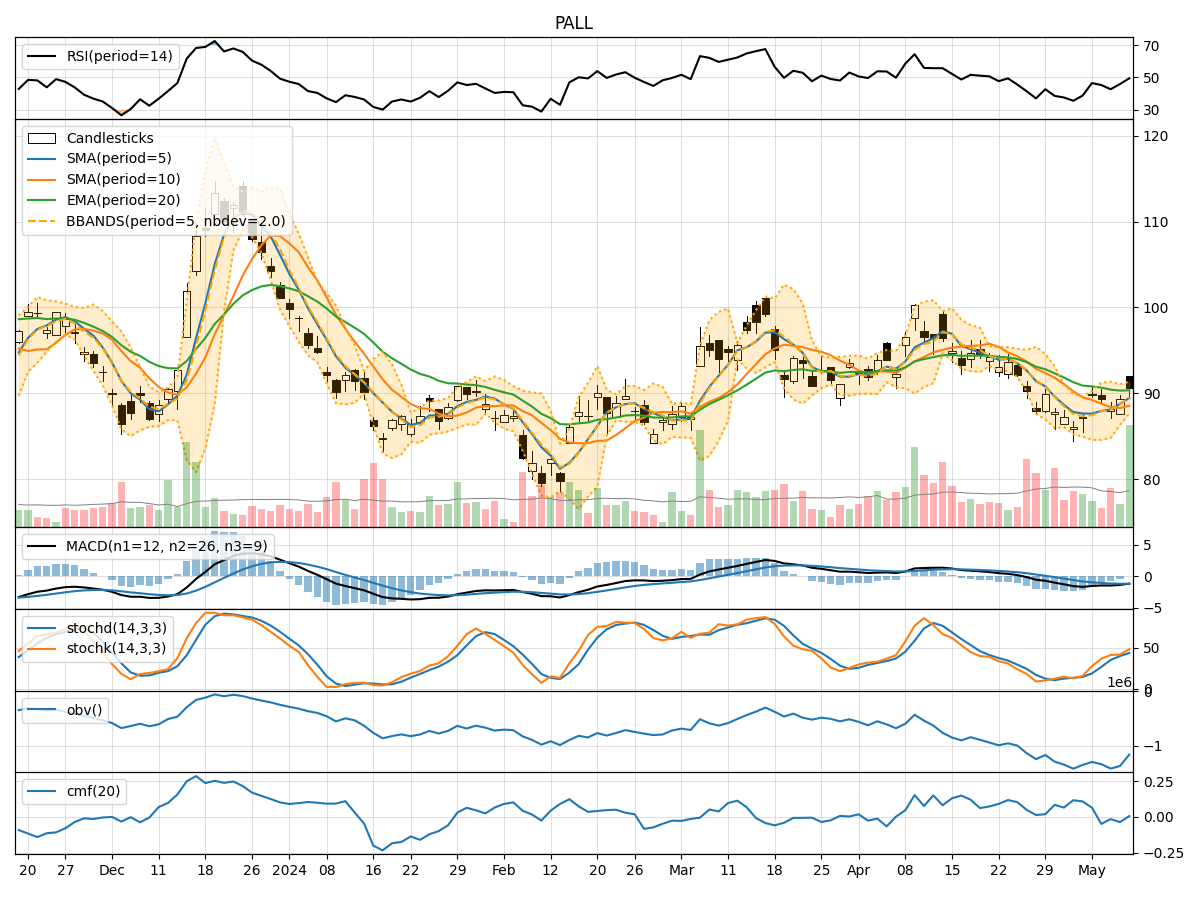
In analyzing the technical indicators for PALL over the last 5 days, we will delve into the trend, momentum, volatility, and volume indicators to provide a comprehensive outlook on the possible stock price movement in the coming days. By examining these key indicators, we aim to offer valuable insights and predictions for informed decision-making.
Trend Analysis:
- Moving Averages (MA): The 5-day MA has been showing a slight uptrend, indicating a short-term positive momentum.
- MACD: The MACD has been consistently negative, suggesting a bearish trend in the short term.
- EMA: The EMA has been declining, reflecting a weakening trend.
Key Observation: The trend indicators point towards a mixed outlook with a slight bullish bias in the short term.
Momentum Analysis:
- RSI: The RSI has been fluctuating around the neutral zone, indicating indecision in the market.
- Stochastic Oscillator: Both %K and %D have been moving upwards, signaling a potential bullish momentum.
- Williams %R: The Williams %R is hovering in the oversold territory, suggesting a possible reversal.
Key Observation: Momentum indicators suggest a potential shift towards bullish sentiment in the near future.
Volatility Analysis:
- Bollinger Bands (BB): The bands have been narrowing, indicating decreasing volatility.
Key Observation: Volatility has been decreasing, which could lead to a period of consolidation or a breakout in the near term.
Volume Analysis:
- On-Balance Volume (OBV): The OBV has been declining, indicating selling pressure in the market.
- Chaikin Money Flow (CMF): The CMF has been negative, reflecting a bearish money flow trend.
Key Observation: Volume indicators suggest a bearish sentiment prevailing in the market.
Conclusion:
Based on the analysis of the technical indicators, the next few days' possible stock price movement for PALL is likely to be sideways with a slight bullish bias. The momentum indicators hint at a potential bullish momentum building up, while the trend indicators show a mixed outlook. The decreasing volatility may lead to a period of consolidation before a possible breakout. However, the volume indicators indicate a bearish sentiment, which could limit the upside potential.
In summary, the stock is likely to experience a period of consolidation with a potential upward bias in the coming days. Traders should closely monitor key support and resistance levels for potential entry and exit points.