Technical Analysis of PDBC 2024-05-10
Overview:
In analyzing the technical indicators for PDBC over the last 5 days, we will delve into the trend, momentum, volatility, and volume indicators to provide a comprehensive outlook on the possible stock price movement in the coming days.
Trend Analysis:
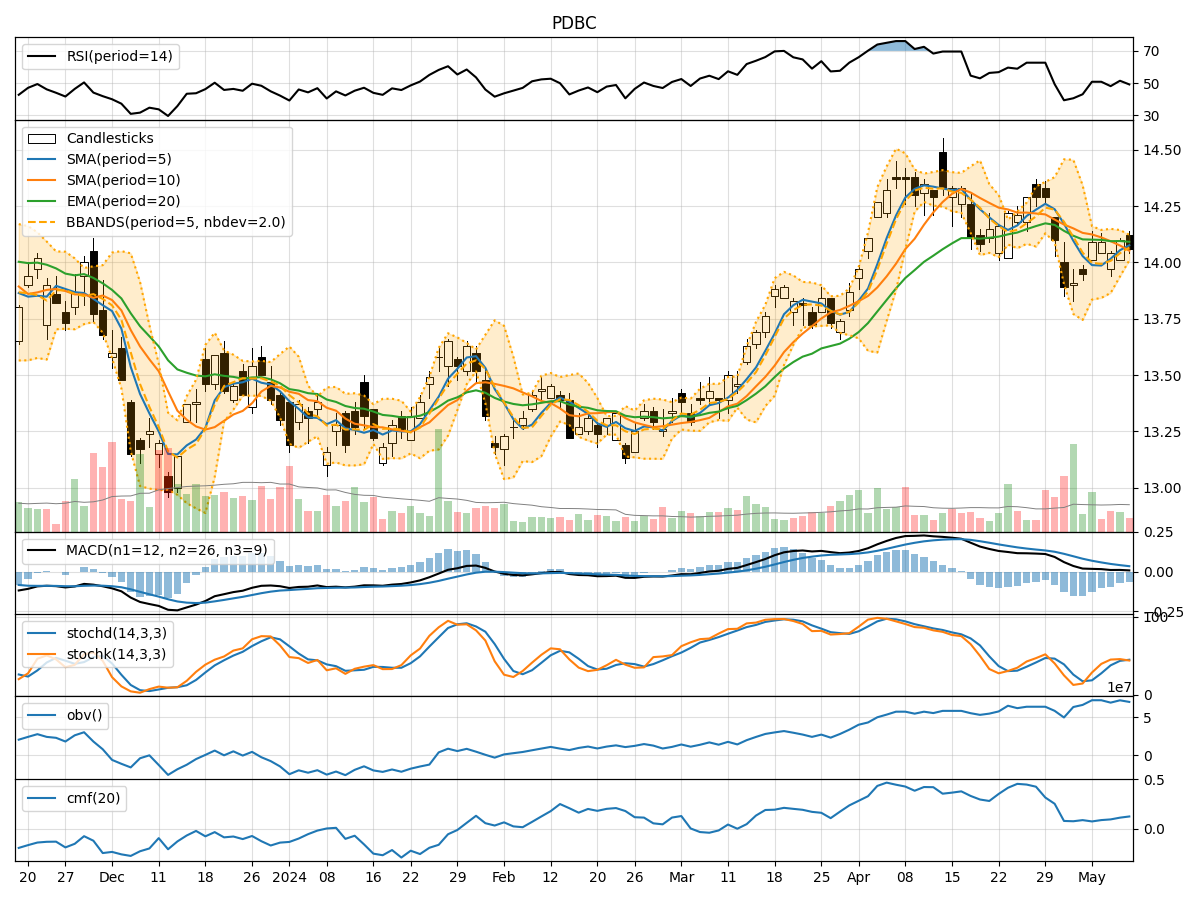
- Moving Averages (MA): The 5-day Moving Average (MA) has been fluctuating around the current price, indicating a lack of clear trend direction.
- MACD: The MACD line has been consistently positive, suggesting some bullish momentum in the short term.
- EMA: The Exponential Moving Average (EMA) has been relatively stable, indicating a potential consolidation phase.
Momentum Analysis:
- RSI: The Relative Strength Index (RSI) has been hovering around the neutral zone, indicating a balanced momentum.
- Stochastic Oscillator: Both %K and %D have been fluctuating, reflecting indecision in momentum.
- Williams %R: The indicator has been showing oversold conditions, suggesting a potential reversal.
Volatility Analysis:
- Bollinger Bands (BB): The bands have been narrowing, indicating decreasing volatility and a possible period of consolidation.
- BB %B: The %B indicator is showing a slight uptrend, suggesting a potential bullish momentum.
Volume Analysis:
- On-Balance Volume (OBV): The OBV has been relatively stable, indicating a balance between buying and selling pressure.
- Chaikin Money Flow (CMF): The CMF has been gradually increasing, indicating a potential influx of buying pressure.
Key Observations:
- The trend indicators suggest a lack of clear direction, with a potential consolidation phase.
- Momentum indicators show mixed signals, with a slight bias towards a potential reversal.
- Volatility indicators point towards decreasing volatility and a possible period of consolidation.
- Volume indicators indicate a balance between buying and selling pressure, with a gradual increase in buying interest.
Conclusion:
Based on the analysis of the technical indicators, the next few days for PDBC could see sideways movement with a slight bullish bias. Traders may expect the stock price to consolidate within a range, with a potential for a minor uptick in momentum. It is advisable to closely monitor key support and resistance levels for potential breakout opportunities.