Technical Analysis of PFIX 2024-05-10
Overview:
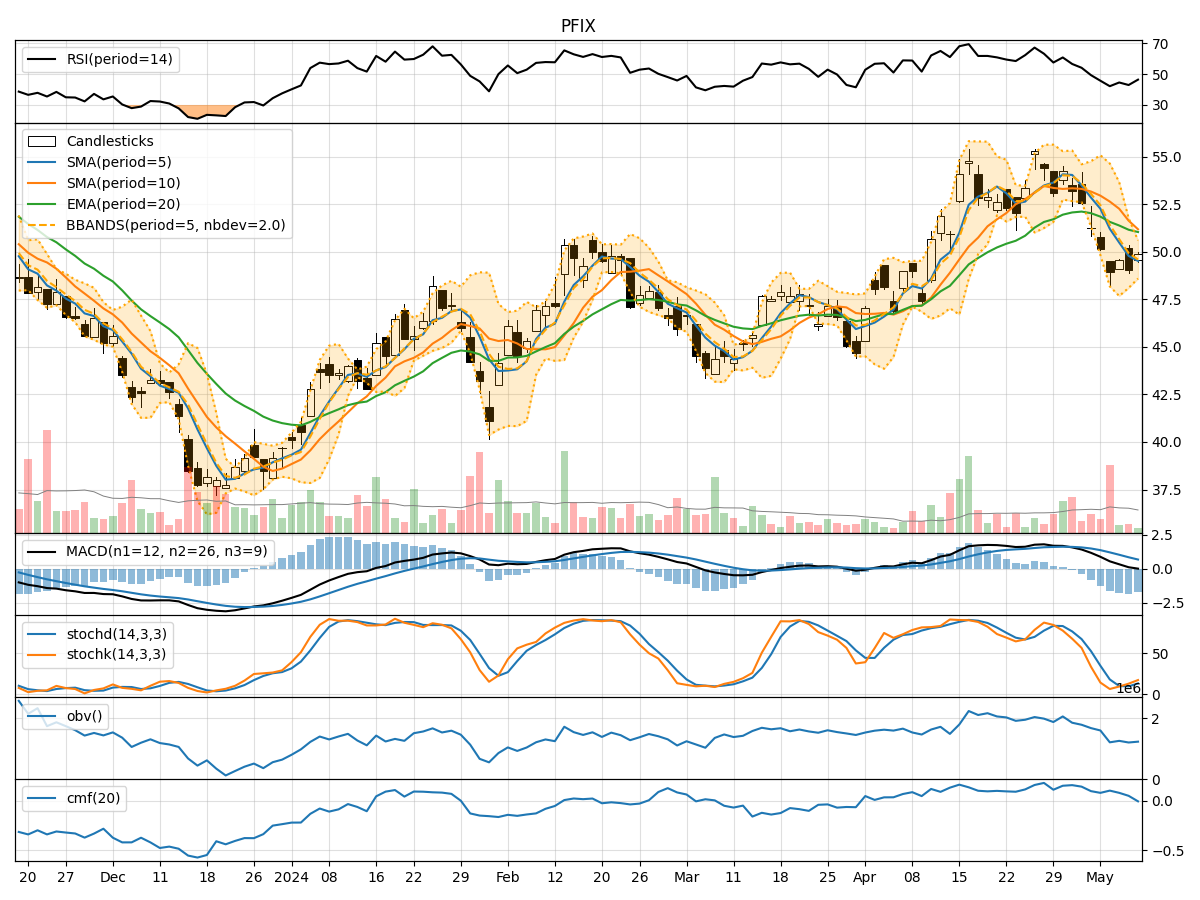
In analyzing the technical indicators for PFIX over the last 5 days, we will delve into the trend, momentum, volatility, and volume indicators to provide a comprehensive assessment of the stock's potential price movement. By examining these key factors, we aim to offer valuable insights and predictions for the next few days.
Trend Analysis:
- Moving Averages (MA): The 5-day MA has been consistently below the closing price, indicating a short-term downtrend.
- MACD: The MACD line has been below the signal line, suggesting a bearish momentum.
- EMA: The EMA has been declining, reflecting a weakening trend.
Key Observation: The trend indicators point towards a bearish sentiment in the short term.
Momentum Analysis:
- RSI: The RSI has been below 50, indicating a lack of strong buying momentum.
- Stochastic Oscillator: Both %K and %D have been below 20, signaling an oversold condition.
- Williams %R: The indicator has consistently been in the oversold territory.
Key Observation: Momentum indicators suggest that the stock is currently oversold and lacking strong buying interest.
Volatility Analysis:
- Bollinger Bands (BB): The stock price has been consistently below the middle band, indicating a downtrend.
- Bollinger %B: The %B has been decreasing, showing a decrease in volatility.
Key Observation: Volatility indicators suggest a decreasing volatility trend.
Volume Analysis:
- On-Balance Volume (OBV): The OBV has been fluctuating, indicating mixed buying and selling pressure.
- Chaikin Money Flow (CMF): The CMF has been positive but decreasing, suggesting weakening buying pressure.
Key Observation: Volume indicators show a mixed sentiment with a slight bias towards selling pressure.
Conclusion:
Based on the analysis of the technical indicators, the next few days' possible stock price movement for PFIX is likely to be downward. The trend indicators, momentum indicators, and volume indicators all point towards a bearish sentiment in the short term. The decreasing trend in moving averages, MACD, RSI, and oversold conditions in the stochastic oscillator and Williams %R support this bearish view. Additionally, the decreasing volatility and mixed volume signals further reinforce the likelihood of a downward movement in the stock price.
Key Conclusion: The overall technical analysis suggests a bearish outlook for PFIX in the next few days. Investors should exercise caution and consider potential short-term selling opportunities or implementing risk management strategies.