Technical Analysis of PGJ 2024-05-10
Overview:
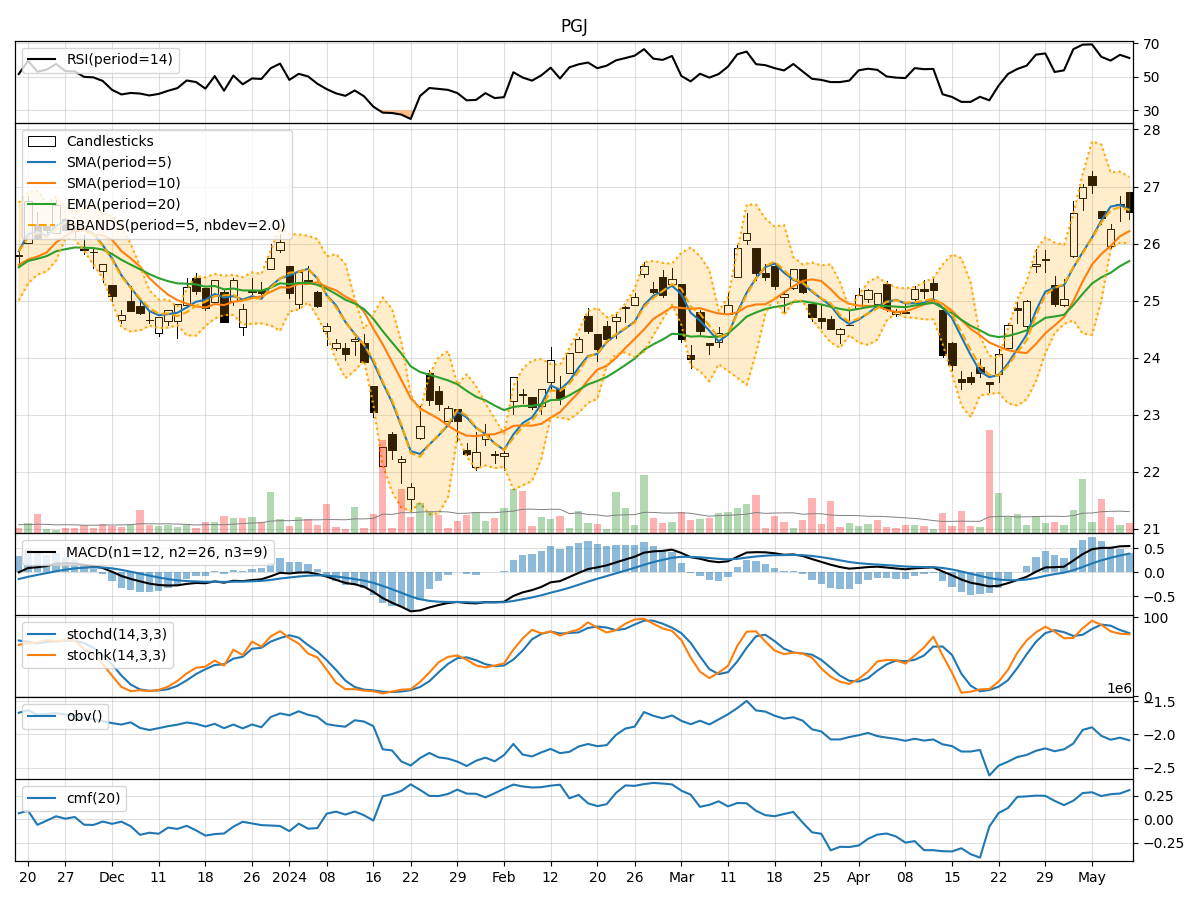
In analyzing the technical indicators for the stock PGJ over the last 5 days, we will delve into the trend, momentum, volatility, and volume indicators to provide a comprehensive outlook on the possible stock price movement in the coming days.
Trend Analysis:
- Moving Averages (MA): The 5-day Moving Average (MA) has been consistently above the Simple Moving Average (SMA) and Exponential Moving Average (EMA), indicating a bullish trend.
- MACD: The MACD line has been above the signal line, with both lines showing an upward trend, suggesting bullish momentum.
Momentum Analysis:
- RSI: The Relative Strength Index (RSI) has been fluctuating around the 60-70 range, indicating a neutral momentum.
- Stochastic Oscillator: Both %K and %D have been hovering around the overbought territory, suggesting a potential reversal or consolidation.
Volatility Analysis:
- Bollinger Bands (BB): The stock price has been trading within the Bollinger Bands, with the bands narrowing, indicating decreasing volatility.
Volume Analysis:
- On-Balance Volume (OBV): The OBV has shown mixed movements, suggesting indecision among investors.
- Chaikin Money Flow (CMF): The CMF has been positive but relatively flat, indicating a neutral sentiment regarding money flow.
Key Observations:
- The trend indicators suggest a bullish sentiment, supported by the moving averages and MACD.
- Momentum indicators show a neutral stance, with RSI indicating neither overbought nor oversold conditions.
- Volatility has been decreasing, as seen in the narrowing Bollinger Bands.
- Volume indicators reflect mixed signals, with OBV showing no clear direction and CMF indicating a neutral money flow sentiment.
Conclusion:
Based on the analysis of the technical indicators, the stock PGJ is likely to experience sideways consolidation in the coming days. The bullish trend indicated by moving averages and MACD may face resistance due to the neutral momentum and mixed volume signals. The decreasing volatility suggests a potential period of consolidation before a clear directional move. Traders should exercise caution and wait for a clearer trend confirmation before making significant trading decisions.