Technical Analysis of PSH 2024-05-10
Overview:
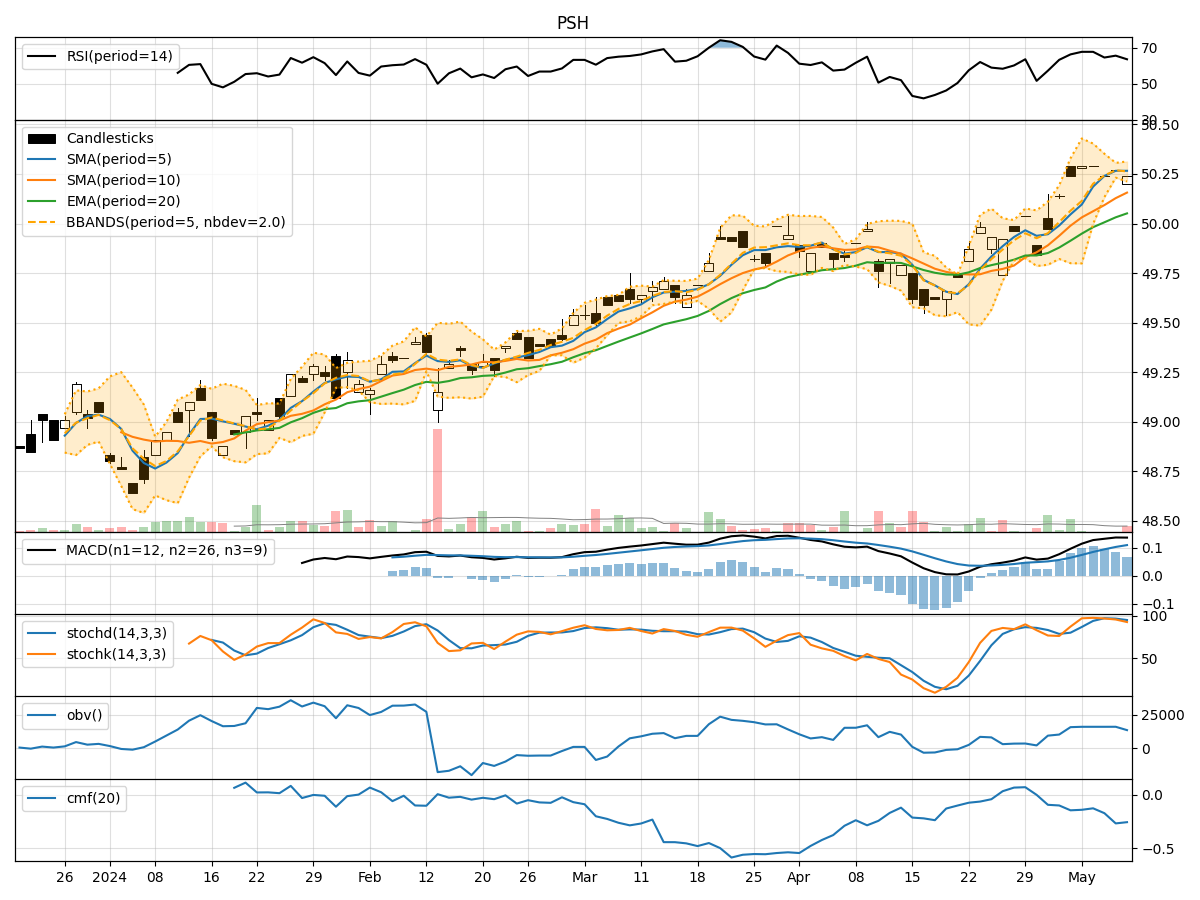
In analyzing the technical indicators for PSH over the last 5 days, we will delve into the trend, momentum, volatility, and volume indicators to provide a comprehensive outlook on the possible stock price movement in the coming days. By examining key metrics such as moving averages, MACD, RSI, Bollinger Bands, and OBV, we aim to offer valuable insights and predictions for potential price trends.
Trend Indicators:
- Moving Averages (MA): The 5-day MA has been consistently above the closing price, indicating a bullish trend.
- MACD: The MACD line has been positive and above the signal line, suggesting upward momentum.
- EMA: The EMA has been trending upwards, supporting the bullish sentiment.
Key Observation: The trend indicators point towards a bullish outlook for PSH.
Momentum Indicators:
- RSI: The RSI has been in the overbought territory, indicating strong buying momentum.
- Stochastic Oscillator: Both %K and %D have been relatively high, signaling bullish momentum.
- Williams %R: The indicator has been in the oversold region, suggesting a potential reversal.
Key Observation: Momentum indicators reflect a bullish sentiment for PSH.
Volatility Indicators:
- Bollinger Bands: The price has been trading within the bands, indicating stable volatility.
Key Observation: Volatility remains stable with no significant spikes.
Volume Indicators:
- On-Balance Volume (OBV): The OBV has been slightly negative, suggesting some distribution.
- Chaikin Money Flow (CMF): The CMF has been negative, indicating outflow of money.
Key Observation: Volume indicators show a slightly bearish sentiment.
Conclusion:
Based on the analysis of trend, momentum, volatility, and volume indicators, the overall outlook for PSH is bullish in the short term. The strong uptrend supported by moving averages and MACD, coupled with positive momentum from RSI and Stochastic Oscillator, indicates a potential for further price appreciation. However, the slightly negative volume indicators suggest caution, as there might be some profit-taking or distribution happening.
Forecast:
Considering the current technical landscape, the next few days for PSH are likely to see upward movement in stock prices. Traders and investors can consider capitalizing on the bullish momentum but should monitor volume closely for any signs of a trend reversal. It is advisable to set appropriate stop-loss levels to manage risk effectively.