Technical Analysis of PUI 2024-05-10
Overview:
In analyzing the technical indicators for PUI stock over the last 5 days, we will delve into the trend, momentum, volatility, and volume indicators to provide a comprehensive outlook on the possible stock price movement in the coming days. By examining these key aspects, we aim to offer valuable insights and predictions to guide investment decisions.
Trend Indicators:
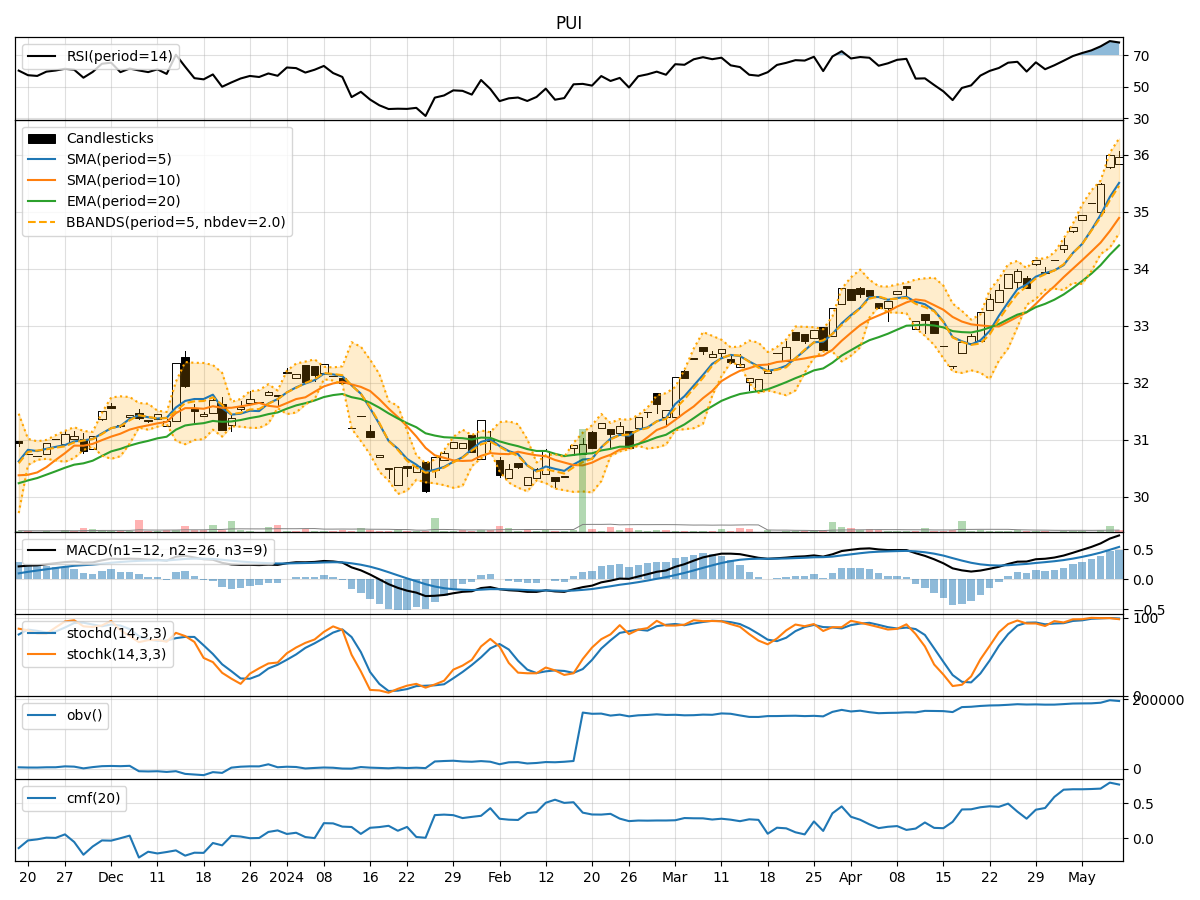
- Moving Averages (MA): The 5-day moving average has been consistently above the short-term (10-day) and medium-term (20-day) moving averages, indicating a bullish trend.
- MACD: The MACD line has been above the signal line, with both lines showing an upward trend, suggesting bullish momentum.
- MACD Histogram: The histogram has been increasing, indicating strengthening bullish momentum.
Momentum Indicators:
- RSI: The Relative Strength Index has been in the overbought territory, suggesting a strong bullish momentum.
- Stochastic Oscillator: Both %K and %D have been in the overbought zone, indicating a strong bullish sentiment.
- Williams %R: The indicator has been in the oversold region, signaling a bearish reversal.
Volatility Indicators:
- Bollinger Bands: The stock price has been consistently trading above the middle Bollinger Band, indicating an upward trend.
- Bollinger Band Width: The band width has been relatively stable, suggesting moderate volatility.
- Bollinger Band %B: The %B indicator has been above 0.5, indicating an upward momentum.
Volume Indicators:
- On-Balance Volume (OBV): The OBV has been steadily increasing, reflecting positive buying pressure.
- Chaikin Money Flow (CMF): The CMF has been above 0, indicating positive money flow into the stock.
Conclusion:
Based on the analysis of the technical indicators, the overall outlook for PUI stock in the next few days is bullish. The trend indicators, momentum indicators, and volume indicators all point towards a continuation of the current upward trend. The stock is likely to experience further price appreciation in the coming days, supported by strong buying pressure and positive momentum.
Key Points:
- Trend: Upward trend with bullish signals from moving averages and MACD.
- Momentum: Strong bullish momentum indicated by RSI and Stochastic Oscillator.
- Volatility: Moderate volatility with an upward bias.
- Volume: Increasing OBV and positive CMF suggest strong buying interest.
Recommendation:
Considering the bullish outlook supported by multiple technical indicators, it is advisable to consider buying or holding PUI stock for potential capital appreciation. Traders may look for entry points on minor pullbacks to capitalize on the upward momentum. However, it is essential to monitor the indicators for any signs of reversal or weakening bullish momentum.