Technical Analysis of QCLN 2024-05-10
Overview:
In analyzing the technical indicators for QCLN over the last 5 days, we will delve into the trend, momentum, volatility, and volume indicators to provide a comprehensive outlook on the possible stock price movement. By examining these key factors, we aim to offer valuable insights and predictions for the upcoming days.
Trend Analysis:
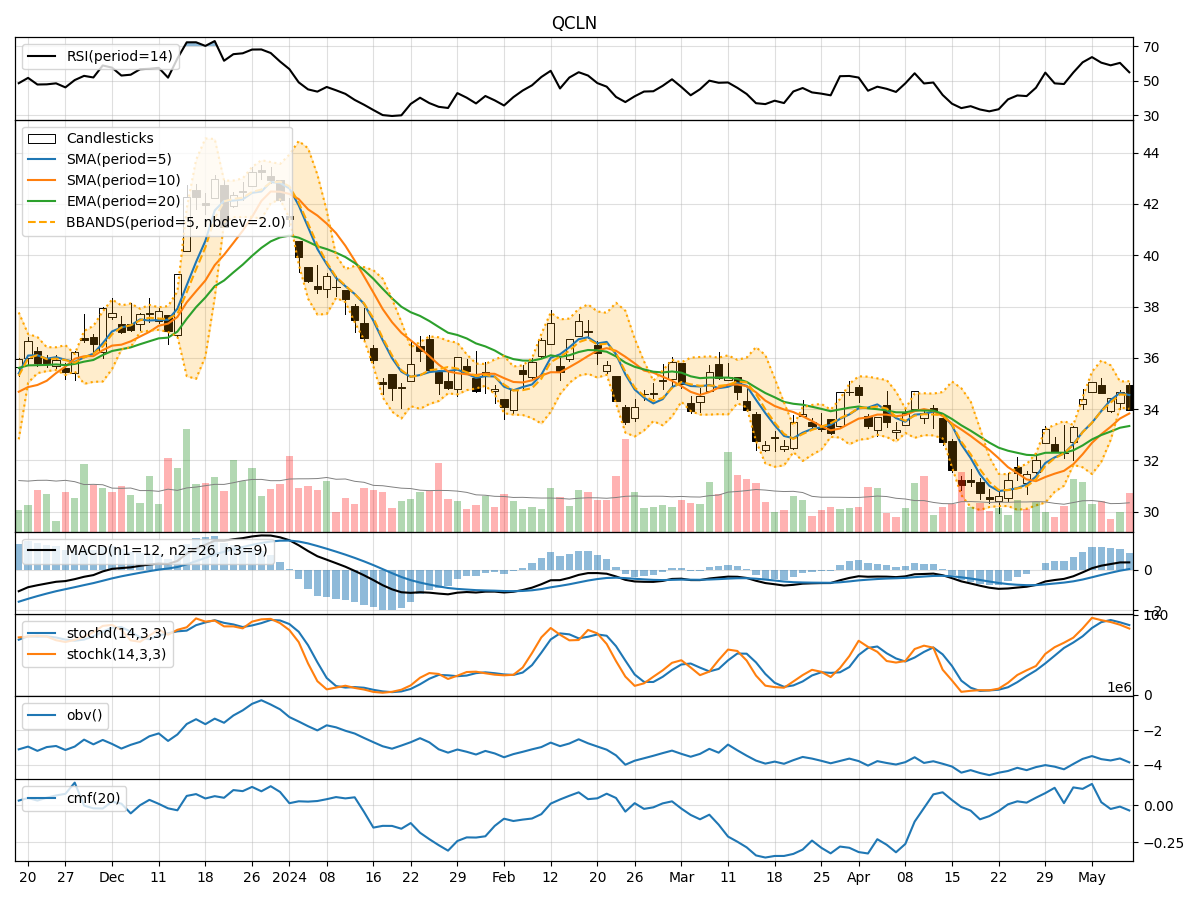
- Moving Averages (MA): The 5-day Moving Average (MA) has been consistently above the Simple Moving Average (SMA) and Exponential Moving Average (EMA), indicating a bullish trend.
- MACD: The MACD line has been above the signal line for the past few days, suggesting positive momentum in the stock price.
Momentum Analysis:
- RSI: The Relative Strength Index (RSI) has been fluctuating around the 50 level, indicating a neutral momentum in the stock.
- Stochastic Oscillator: The Stochastic indicators have been gradually decreasing, signaling a potential bearish momentum.
Volatility Analysis:
- Bollinger Bands (BB): The Bollinger Bands have been narrowing, suggesting decreasing volatility in the stock price.
Volume Analysis:
- On-Balance Volume (OBV): The OBV has been consistently negative, indicating a higher selling pressure in the stock.
- Chaikin Money Flow (CMF): The CMF has been negative, reflecting a bearish sentiment in the stock.
Key Observations and Opinions:
- Trend: The stock is currently in an upward trend based on moving averages and MACD.
- Momentum: The momentum indicators are showing a neutral to bearish bias with RSI around 50 and decreasing Stochastic values.
- Volatility: The decreasing Bollinger Bands suggest lower volatility in the stock price.
- Volume: The negative OBV and CMF indicate higher selling pressure and bearish sentiment in the stock.
Conclusion:
Based on the analysis of the technical indicators, the next few days' possible stock price movement for QCLN is likely to be sideways to slightly bearish. The stock may experience some consolidation or minor downward movements due to the neutral to bearish momentum and higher selling pressure indicated by volume indicators. Traders and investors should exercise caution and consider waiting for clearer signals before making significant trading decisions.