Technical Analysis of QLTA 2024-05-10
Overview:
In analyzing the technical indicators for QLTA over the last 5 days, we will delve into the trend, momentum, volatility, and volume indicators to provide a comprehensive outlook on the possible stock price movement in the coming days. By examining these key indicators, we aim to offer valuable insights and predictions for potential investors.
Trend Analysis:
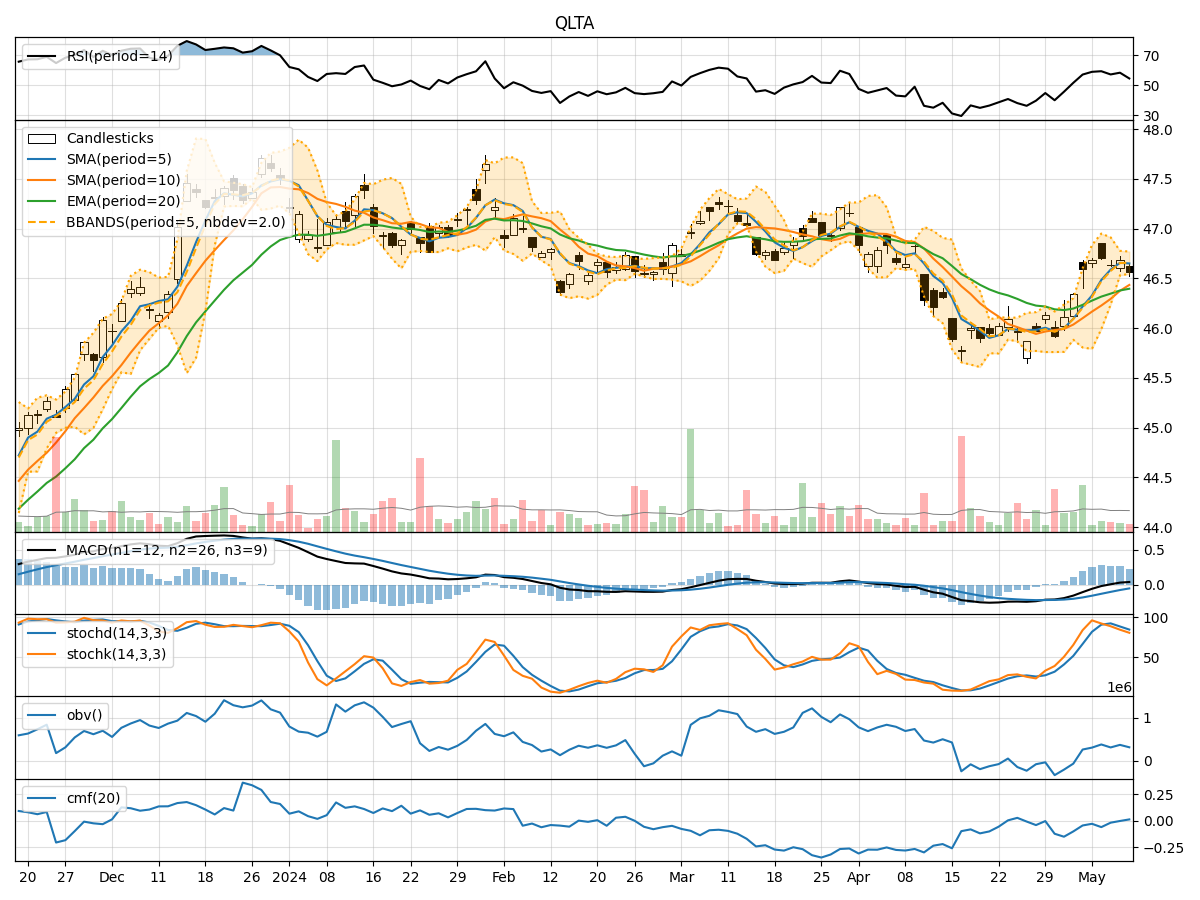
- Moving Averages (MA): The 5-day Moving Average (MA) has been consistently above the Simple Moving Average (SMA) and Exponential Moving Average (EMA), indicating a short-term bullish trend.
- MACD: The MACD line has been consistently above the signal line, with both lines showing an upward trend, suggesting bullish momentum.
- MACD Histogram: The MACD Histogram has been increasing over the past 5 days, indicating strengthening bullish momentum.
Momentum Analysis:
- RSI: The Relative Strength Index (RSI) has been fluctuating around the 50 level, indicating a neutral momentum.
- Stochastic Oscillator: Both %K and %D lines of the Stochastic Oscillator have been decreasing, suggesting a potential reversal in momentum to the downside.
- Williams %R: The Williams %R indicator has been in the oversold territory, indicating a potential buying opportunity.
Volatility Analysis:
- Bollinger Bands: The stock price has been trading within the Bollinger Bands, with the bands narrowing, suggesting a period of low volatility.
- Bollinger %B: The %B indicator has been hovering around the middle line, indicating a balanced market sentiment.
Volume Analysis:
- On-Balance Volume (OBV): The OBV indicator has been fluctuating, indicating a balance between buying and selling pressure.
- Chaikin Money Flow (CMF): The CMF has been negative, suggesting a slight outflow of money from the stock.
Conclusion:
Based on the analysis of the technical indicators, the next few days' possible stock price movement for QLTA could be sideways with a slight bearish bias. The trend indicators suggest a bullish sentiment in the short term, while the momentum indicators show a neutral to slightly bearish outlook. The volatility indicators point towards a period of low volatility, and the volume indicators indicate a balance between buying and selling pressure.
Considering the overall picture painted by the technical indicators, it is advisable to exercise caution and closely monitor the stock's price action in the coming days. Investors may consider waiting for more clarity in the market dynamics before making significant trading decisions.