Technical Analysis of QQEW 2024-05-31
Overview:
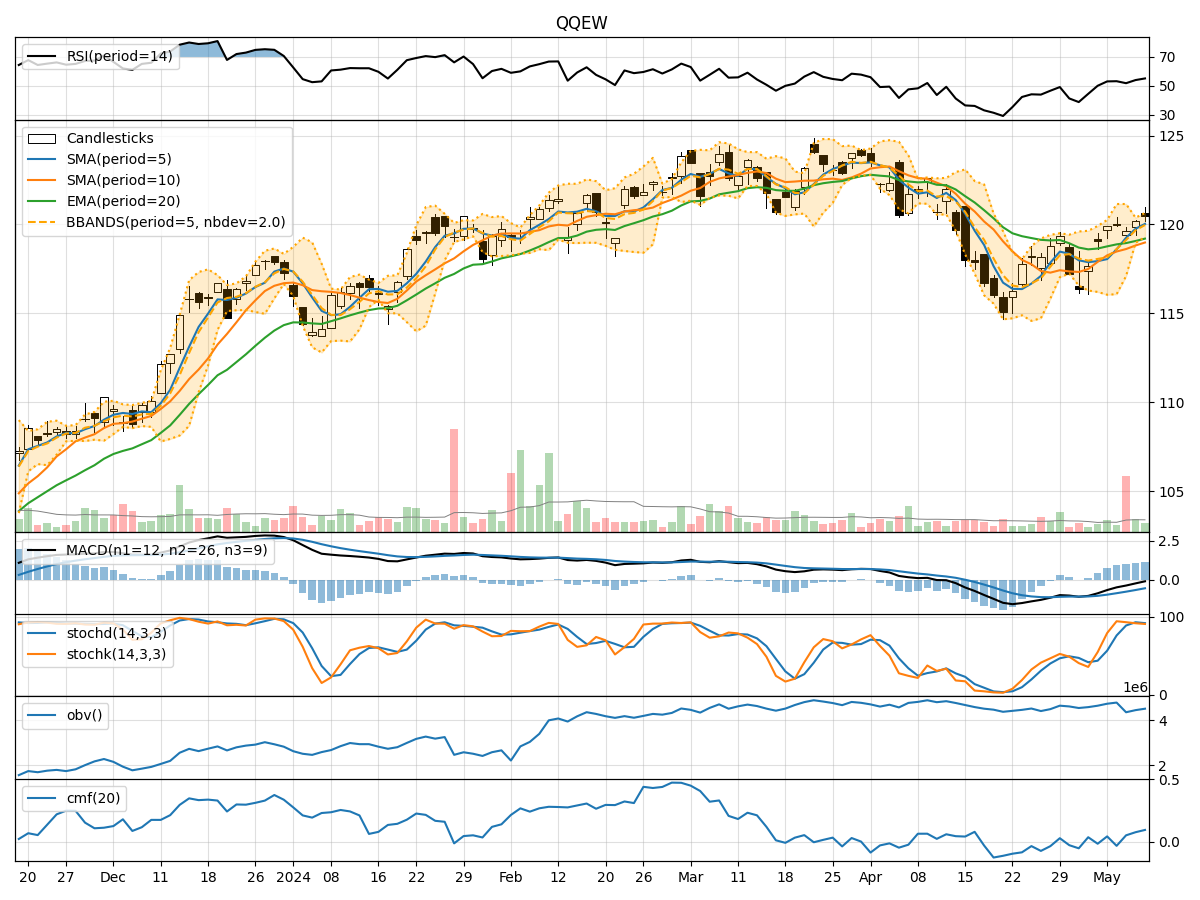
In the last 5 trading days, the QQEW stock has shown a slight decline in price from 122.96 to 120.51. Various technical indicators across trend, momentum, volatility, and volume have been analyzed to provide insights into the possible future stock price movement.
Trend Analysis:
- Moving Averages (MA): The 5-day MA has been consistently below the closing price, indicating a short-term bearish trend.
- Exponential Moving Average (EMA): The EMA has been declining, suggesting a bearish sentiment in the stock.
- Moving Average Convergence Divergence (MACD): The MACD and Signal line have been decreasing, indicating a weakening trend.
Momentum Analysis:
- Relative Strength Index (RSI): The RSI has been declining but is still above the oversold threshold, indicating a potential for further downside.
- Stochastic Oscillator: Both %K and %D have been decreasing, signaling a bearish momentum.
- Williams %R (Willams %R): The indicator is in the oversold region, suggesting a potential reversal or consolidation.
Volatility Analysis:
- Bollinger Bands (BB): The bands have been narrowing, indicating decreasing volatility in the stock.
- Bollinger Band %B (BB %B): The %B is below 0.2, suggesting the stock is oversold.
- Bollinger Band Width (BBW): The band width has been contracting, indicating reduced price volatility.
Volume Analysis:
- On-Balance Volume (OBV): The OBV has been fluctuating, indicating indecision among investors.
- Chaikin Money Flow (CMF): The CMF has been relatively stable, suggesting a neutral sentiment regarding money flow.
Key Observations:
- Trend: The stock is in a short-term bearish trend based on moving averages and MACD.
- Momentum: Momentum indicators suggest a bearish sentiment with potential for a reversal indicated by Williams %R.
- Volatility: Volatility has been decreasing, indicating a possible period of consolidation.
- Volume: Volume indicators show mixed signals, reflecting uncertainty among market participants.
Conclusion:
Based on the analysis of technical indicators, the next few days' possible stock price movement for QQEW is likely to continue on a downward trajectory. The bearish trend, momentum, and oversold conditions suggest further downside potential. However, the narrowing volatility and potential reversal signals from Williams %R could lead to a period of consolidation before a definitive direction is established. Investors should exercise caution and consider risk management strategies in the current market environment.