Technical Analysis of RDFI 2024-05-10
Overview:
In analyzing the technical indicators for RDFI over the last 5 days, we will delve into the trend, momentum, volatility, and volume indicators to provide a comprehensive outlook on the possible stock price movement in the coming days. By examining these key aspects, we aim to offer valuable insights and recommendations for potential investors.
Trend Indicators:
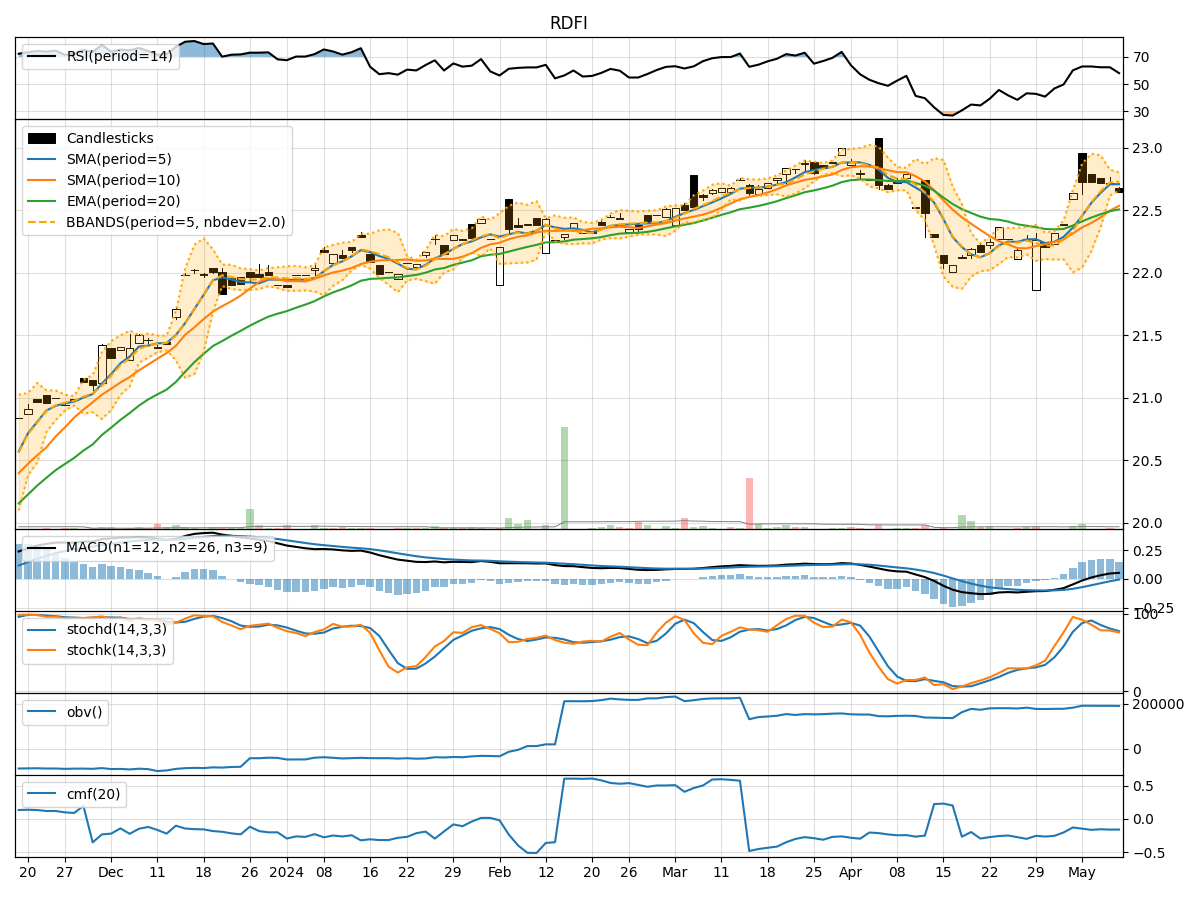
- Moving Averages (MA): The 5-day MA has been consistently above the closing prices, indicating a short-term uptrend.
- MACD: The MACD line has been positive, suggesting bullish momentum.
- RSI: The RSI values have been in the neutral to overbought territory, reflecting positive investor sentiment.
Momentum Indicators:
- Stochastic Oscillator: The stochastic indicators have been in the overbought region, signaling a potential reversal or consolidation.
- Williams %R: The Williams %R values have been in the oversold territory, indicating a possible buying opportunity.
Volatility Indicators:
- Bollinger Bands (BB): The stock price has been trading within the upper and lower bands, suggesting a period of consolidation.
- Volatility: The volatility has been relatively low, indicating a stable price movement.
Volume Indicators:
- On-Balance Volume (OBV): The OBV has been relatively flat, indicating a balance between buying and selling pressure.
- Chaikin Money Flow (CMF): The CMF has been negative, suggesting outflows from the stock.
Key Observations:
- The trend indicators show a bullish bias with positive MACD and MA trends.
- Momentum indicators indicate a potential reversal or consolidation due to overbought stochastic levels.
- Volatility indicators suggest a period of consolidation with stable price movements.
- Volume indicators reflect a balance between buying and selling pressure with negative CMF values.
Conclusion:
Based on the analysis of the technical indicators, the stock price of RDFI is likely to experience a period of consolidation in the coming days. The bullish trend may face resistance due to overbought stochastic levels, leading to a potential sideways movement. Investors should exercise caution and wait for clearer signals before making significant trading decisions.