Technical Analysis of REGL 2024-05-10
Overview:
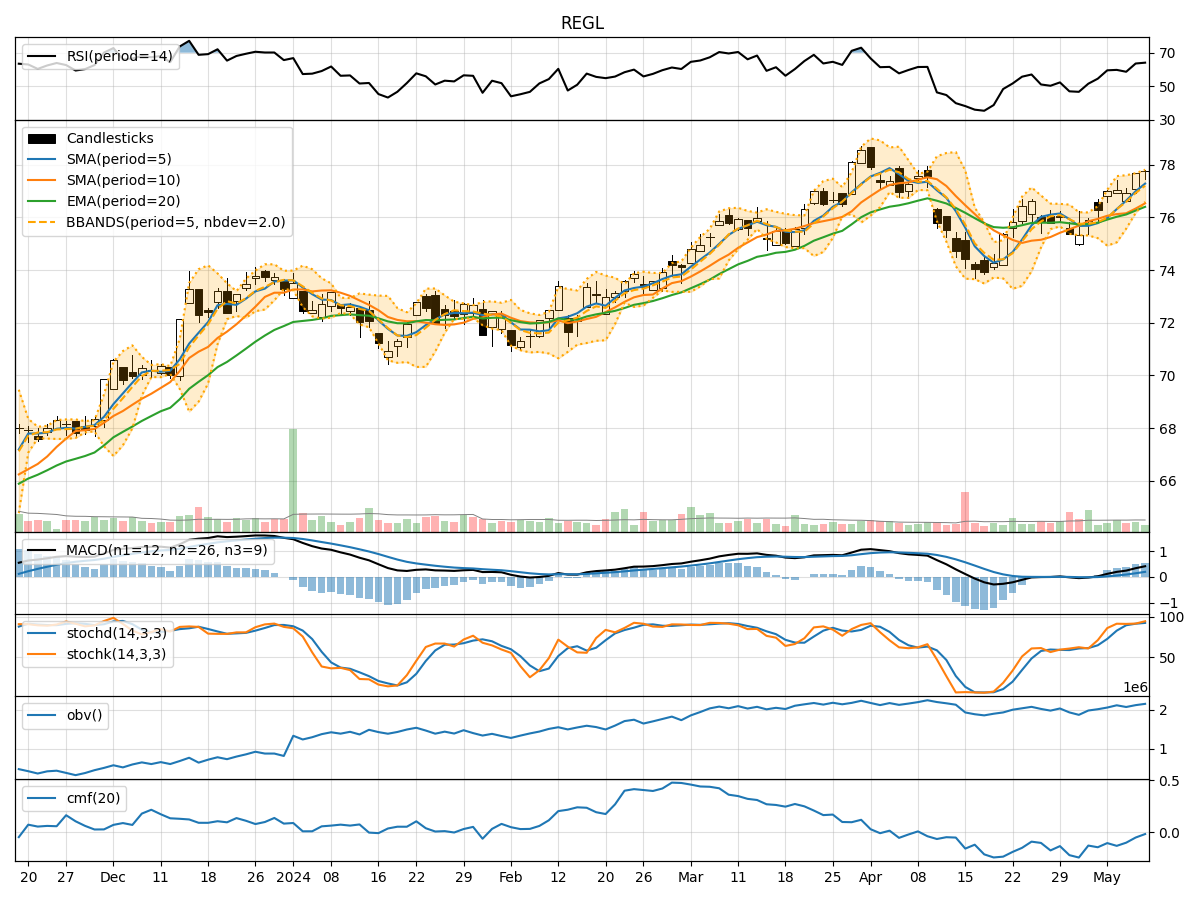
In analyzing the technical indicators for REGL over the last 5 days, we will delve into the trend, momentum, volatility, and volume indicators to provide a comprehensive outlook on the possible stock price movement in the coming days.
Trend Indicators:
- Moving Averages (MA): The 5-day MA has been consistently rising, indicating a bullish trend.
- MACD: The MACD line has been above the signal line, suggesting a bullish momentum.
- EMA: The EMA has been trending upwards, supporting the bullish sentiment.
Momentum Indicators:
- RSI: The RSI has been in the overbought territory, indicating a strong bullish momentum.
- Stochastic Oscillator: Both %K and %D have been in the overbought zone, signaling a potential reversal.
- Williams %R: The indicator has been fluctuating around oversold levels, suggesting a mixed sentiment.
Volatility Indicators:
- Bollinger Bands: The stock price has been trading near the upper band, indicating high volatility.
- Bollinger %B: The %B indicator has been above 0.8, suggesting an overbought condition.
Volume Indicators:
- On-Balance Volume (OBV): The OBV has been relatively flat, indicating a lack of strong buying or selling pressure.
- Chaikin Money Flow (CMF): The CMF has been negative, reflecting a bearish money flow.
Key Observations:
- The trend indicators point towards a bullish sentiment with rising moving averages and positive MACD.
- Momentum indicators show a strong bullish momentum but also hint at a potential reversal with overbought conditions.
- Volatility indicators suggest high volatility and an overbought market condition.
- Volume indicators indicate a lack of significant buying pressure and a bearish money flow.
Conclusion:
Based on the analysis of the technical indicators, the stock price of REGL is likely to experience a short-term pullback or consolidation in the coming days. The overbought conditions in momentum and volatility indicators, coupled with the lack of strong buying pressure in volume indicators, suggest a potential reversal or sideways movement. Traders should exercise caution and consider waiting for a clearer signal before making any significant trading decisions.