Technical Analysis of RENW 2024-05-10
Overview:
In analyzing the technical indicators for RENW over the last 5 days, we will delve into the trend, momentum, volatility, and volume indicators to provide a comprehensive outlook on the possible stock price movement in the coming days.
Trend Analysis:
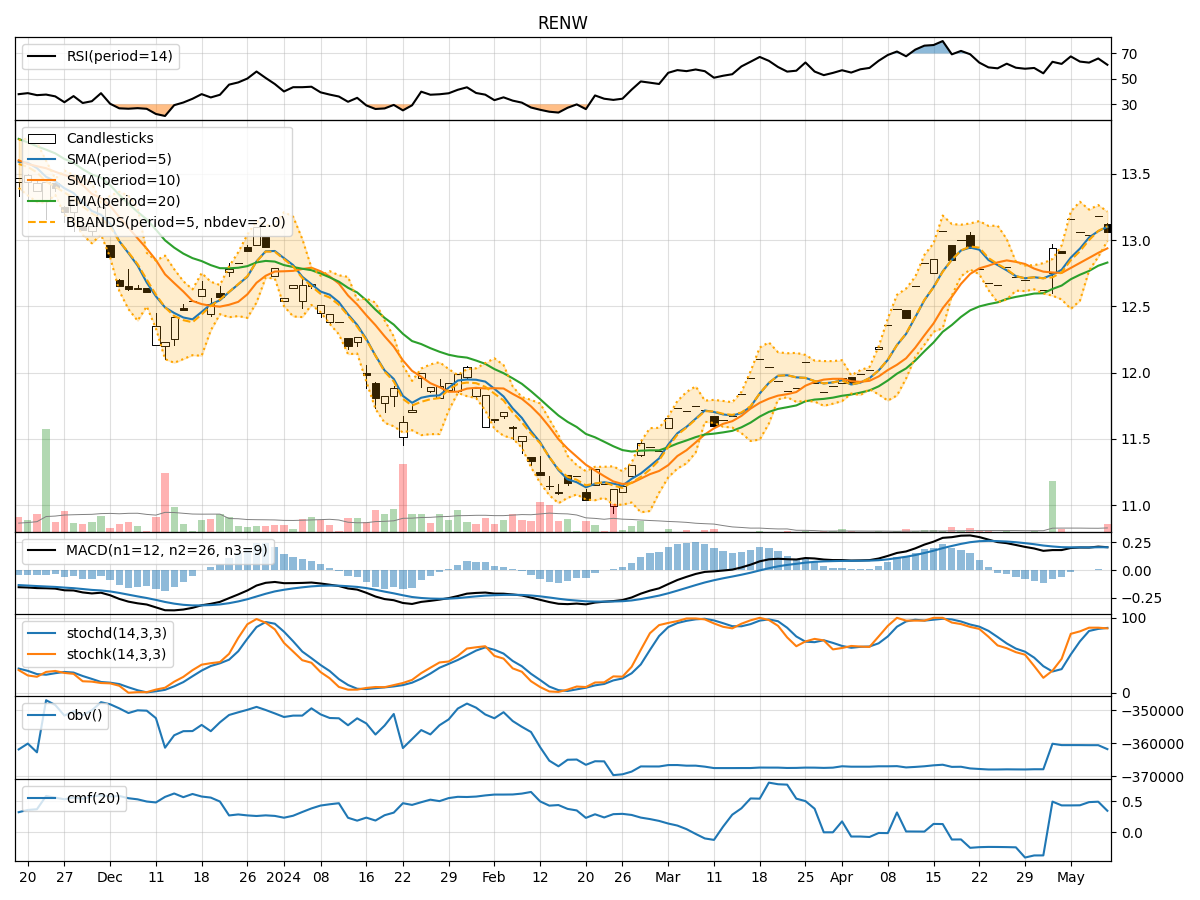
- Moving Averages (MA): The 5-day Moving Average (MA) has been consistently above the Simple Moving Average (SMA) and Exponential Moving Average (EMA), indicating a bullish trend.
- MACD: The MACD line has been fluctuating around the signal line, suggesting a potential reversal or consolidation phase.
Momentum Analysis:
- RSI: The Relative Strength Index (RSI) has been oscillating within the neutral range, indicating a lack of strong momentum.
- Stochastic Oscillator: Both %K and %D have been in the overbought zone, signaling a potential reversal or pullback.
Volatility Analysis:
- Bollinger Bands (BB): The stock price has been trading within the Bollinger Bands, with the bands narrowing, indicating decreasing volatility.
Volume Analysis:
- On-Balance Volume (OBV): The OBV has been slightly decreasing, suggesting a divergence between price and volume.
- Chaikin Money Flow (CMF): The CMF has been fluctuating, indicating mixed buying and selling pressure.
Key Observations:
- The trend is bullish based on moving averages, but the MACD suggests a possible reversal.
- Momentum indicators show a lack of strong momentum and potential overbought conditions.
- Volatility is decreasing, indicating a possible consolidation phase.
- Volume indicators show a divergence between price and volume, with mixed buying and selling pressure.
Conclusion:
Based on the analysis of the technical indicators, the stock price of RENW is likely to experience sideways movement or consolidation in the coming days. The bullish trend indicated by moving averages may face resistance due to the potential reversal suggested by the MACD. The lack of strong momentum and overbought conditions in the stochastic oscillator further support a sideways movement. Decreasing volatility and mixed volume indicators also point towards a period of consolidation. Therefore, the next few days are likely to see RENW trading in a sideways range with no clear directional bias.