Technical Analysis of RFV 2024-05-10
Overview:
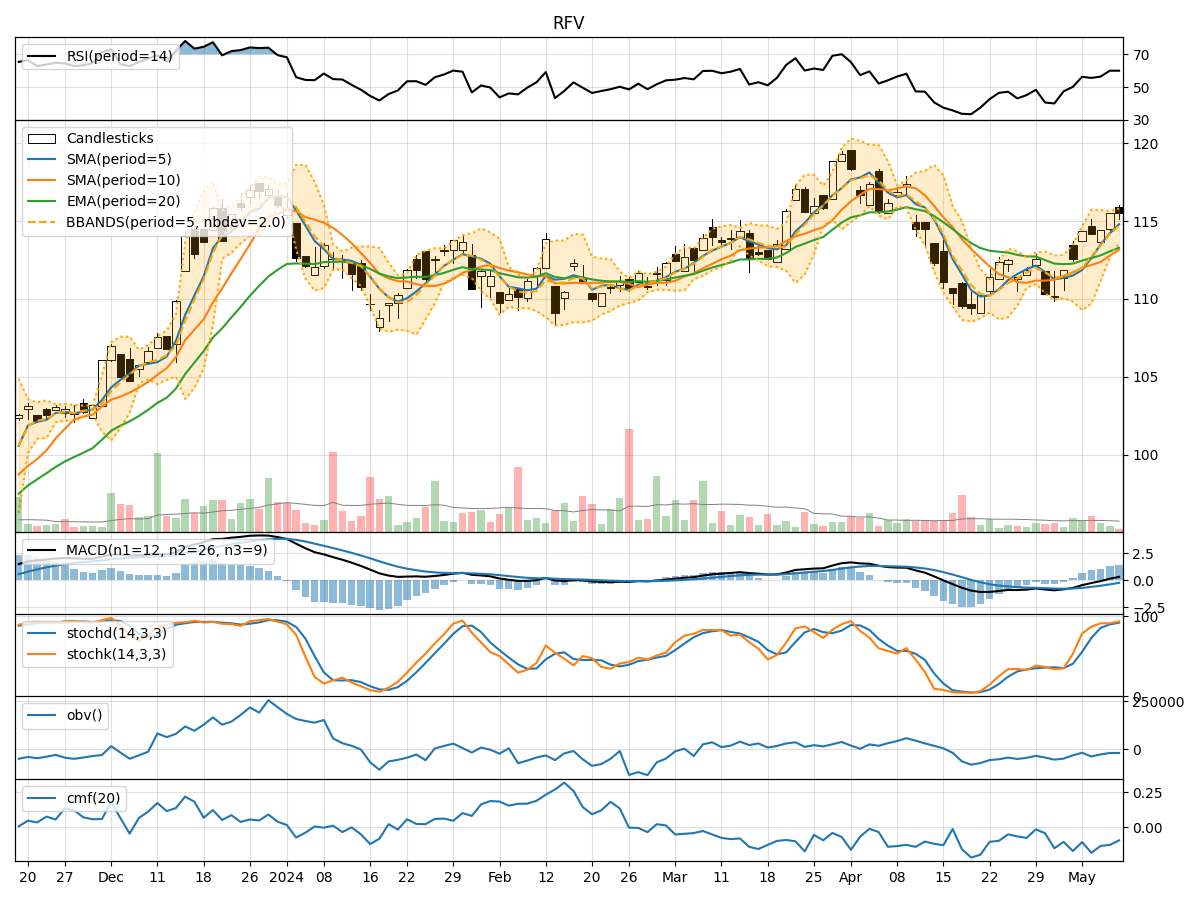
In analyzing the RFV stock using technical indicators over the last 5 days, we will delve into trend, momentum, volatility, and volume indicators to forecast the possible stock price movement in the upcoming days. By examining these indicators, we aim to provide a comprehensive and insightful prediction for the RFV stock.
Trend Indicators:
- Moving Averages (MA): The 5-day MA has been consistently above the closing prices, indicating a bullish trend.
- MACD: The MACD line has been positive and increasing, suggesting bullish momentum.
- RSI: The RSI has been in the neutral zone, indicating a balanced market sentiment.
Key Observation: The trend indicators suggest a bullish sentiment in the RFV stock.
Momentum Indicators:
- Stochastic Oscillator: The stochastic oscillator has been in the overbought region, signaling a potential reversal.
- Williams %R (WillR): The Williams %R has been fluctuating around the oversold region, indicating a mixed sentiment.
Key Observation: Momentum indicators show conflicting signals, with stochastic indicating a possible reversal and Williams %R showing mixed sentiment.
Volatility Indicators:
- Bollinger Bands (BB): The stock price has been trading within the Bollinger Bands, suggesting a stable price movement.
- Volatility: The volatility has been decreasing, indicating a potential consolidation phase.
Key Observation: Volatility indicators point towards a consolidation phase with stable price movement.
Volume Indicators:
- On-Balance Volume (OBV): The OBV has been relatively stable, indicating a balance between buying and selling pressure.
- Chaikin Money Flow (CMF): The CMF has been negative, suggesting a slight outflow of money from the stock.
Key Observation: Volume indicators reflect a balanced market sentiment with a slight outflow of money.
Conclusion:
Based on the analysis of trend, momentum, volatility, and volume indicators, the RFV stock is likely to experience a period of consolidation in the upcoming days. The bullish trend indicated by moving averages and MACD may face resistance due to the overbought stochastic oscillator. The stable price movement within the Bollinger Bands and decreasing volatility further support the consolidation view. The balanced volume indicators suggest that the stock is likely to trade within a range without significant price movements.
Recommendation:
- Short-term Traders: Consider taking profits or reducing positions as the stock enters a consolidation phase.
- Long-term Investors: Monitor the stock for a potential entry point during the consolidation for a more favorable risk-reward ratio.
In conclusion, the RFV stock is expected to consolidate in the near term, presenting both trading and investment opportunities for market participants.