Technical Analysis of RING 2024-05-10
Overview:
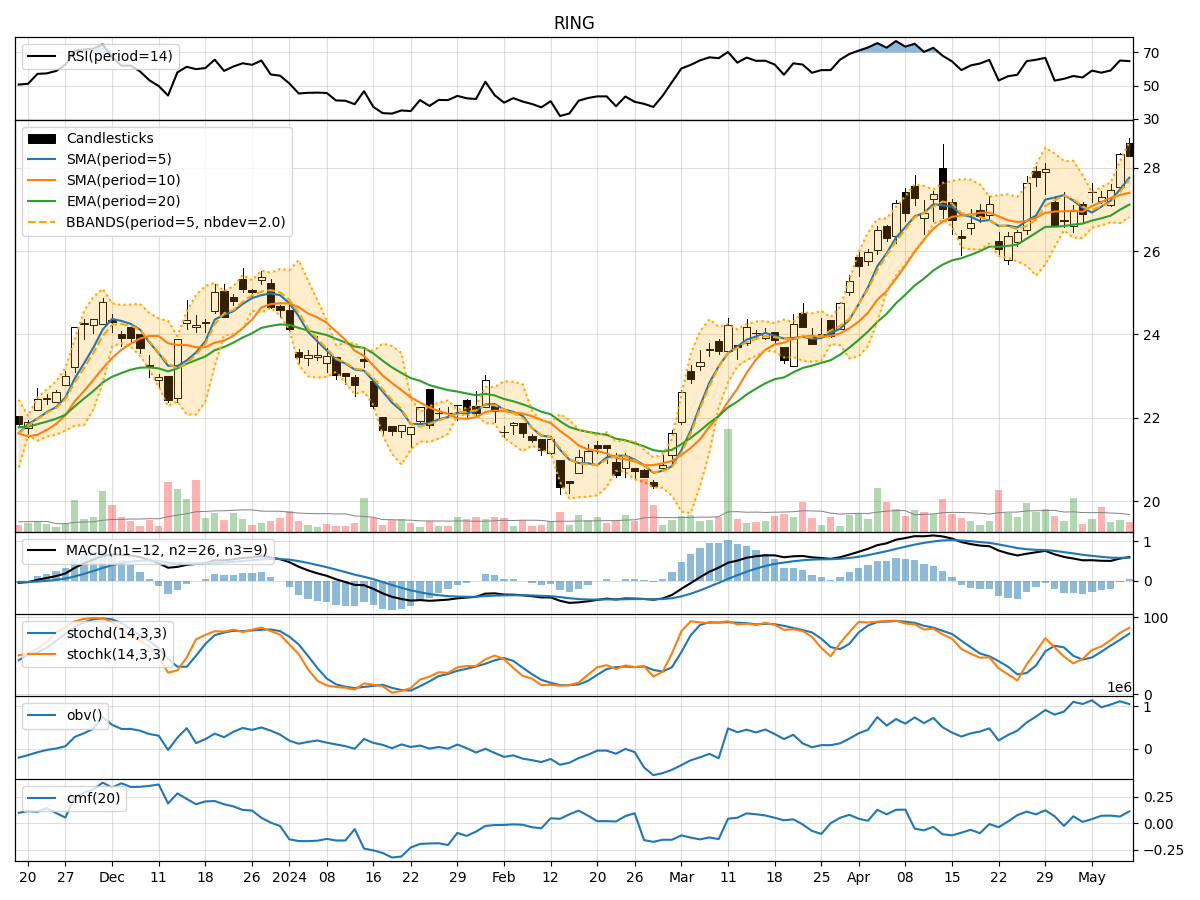
In analyzing the technical indicators for RING stock over the last 5 days, we will delve into the trend, momentum, volatility, and volume indicators to provide a comprehensive outlook on the possible stock price movement in the coming days.
Trend Analysis:
- Moving Averages (MA): The 5-day Moving Average (MA) has been trending upwards, indicating a positive short-term trend in the stock price.
- MACD: The MACD line has been consistently above the signal line, suggesting bullish momentum in the stock.
- EMA: The Exponential Moving Average (EMA) has been steadily increasing, reflecting a positive price trend.
Key Observation: The trend indicators point towards a bullish sentiment in the stock price.
Momentum Analysis:
- RSI: The Relative Strength Index (RSI) has been in the overbought territory, indicating strong buying momentum.
- Stochastic Oscillator: Both %K and %D have been in the overbought zone, signaling a potential reversal in the stock price.
- Williams %R: The Williams %R is in the oversold region, suggesting a possible upcoming price correction.
Key Observation: The momentum indicators show conflicting signals, with RSI indicating strength and Stochastic and Williams %R hinting at a potential pullback.
Volatility Analysis:
- Bollinger Bands: The Bollinger Bands have been widening, indicating increased volatility in the stock price.
- Bollinger %B: The %B indicator is below 1, suggesting that the stock price is trading below the upper Bollinger Band.
Key Observation: The volatility indicators suggest heightened price fluctuations, potentially leading to significant price movements.
Volume Analysis:
- On-Balance Volume (OBV): The OBV has shown a mixed trend over the last 5 days, with no clear direction in volume accumulation.
- Chaikin Money Flow (CMF): The CMF has been positive, indicating buying pressure in the stock.
Key Observation: Volume indicators do not provide a clear signal on the stock's future direction due to the mixed trends in OBV.
Conclusion:
Based on the analysis of the technical indicators, the stock price of RING is likely to experience increased volatility in the coming days. The trend indicators suggest a bullish bias, supported by the positive moving averages and MACD. However, the momentum indicators show conflicting signals, with RSI indicating strength but Stochastic and Williams %R pointing towards a potential pullback.
Considering the heightened volatility and mixed momentum signals, it is crucial for investors to closely monitor the price action and wait for a clearer trend confirmation before making any trading decisions. Caution is advised due to the conflicting signals in momentum indicators, which could lead to choppy price movements or a potential reversal in the stock price.
In conclusion, while the trend remains bullish, investors should exercise patience and vigilance in navigating the market dynamics of RING stock in the upcoming trading sessions.