Technical Analysis of RSPF 2024-05-10
Overview:
In analyzing the technical indicators for RSPF over the last 5 days, we will delve into the trends, momentum, volatility, and volume aspects to provide a comprehensive outlook on the possible stock price movement in the coming days. By examining key indicators such as moving averages, MACD, RSI, Stochastic Oscillator, Bollinger Bands, and volume analysis, we aim to offer valuable insights and predictions for informed decision-making.
Trend Analysis:
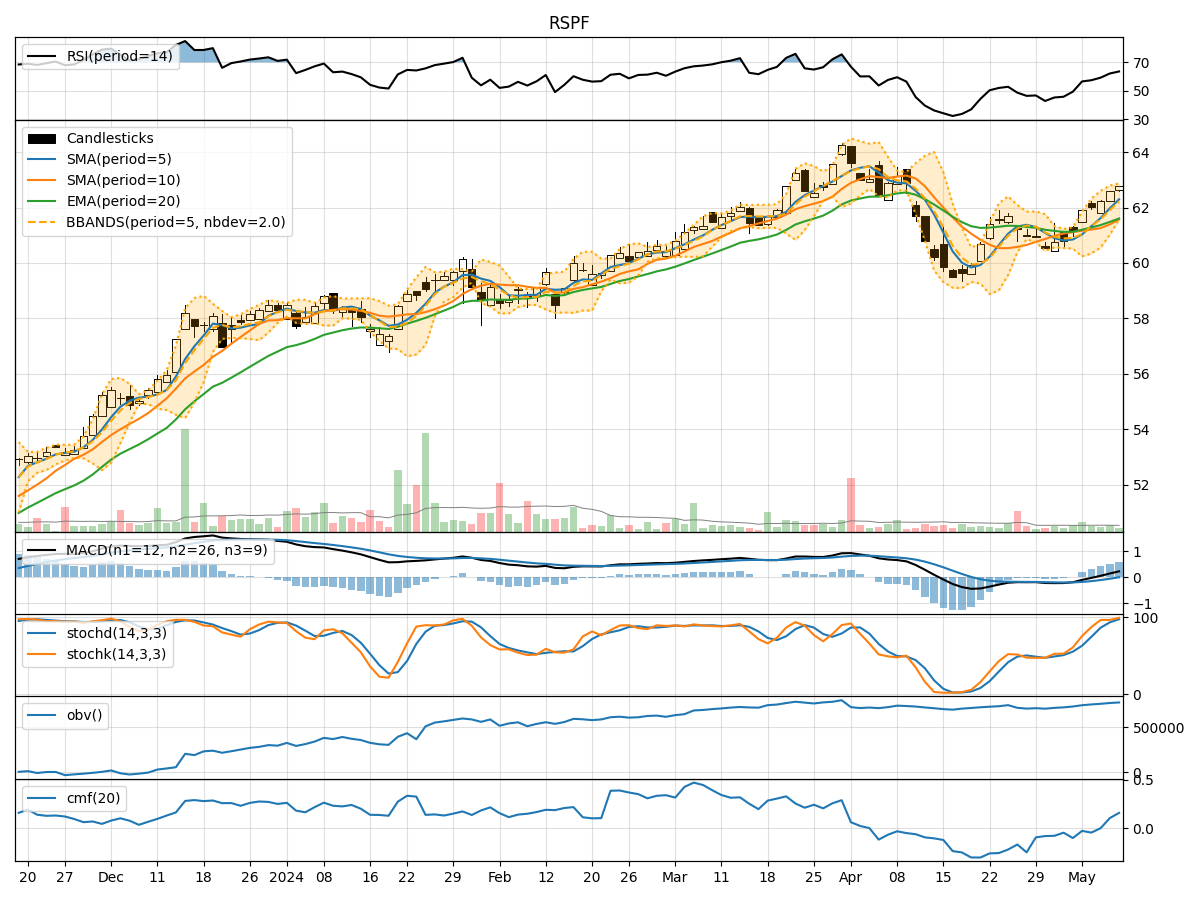
- Moving Averages (MA): The 5-day moving average has been consistently rising, indicating a bullish trend in the short term.
- MACD: The MACD line has been above the signal line for the past few days, suggesting a bullish momentum.
Momentum Analysis:
- RSI: The RSI has been trending upwards and is currently in the overbought territory, signaling a strong bullish momentum.
- Stochastic Oscillator: Both %K and %D lines are in the overbought zone, indicating a potential reversal or consolidation.
Volatility Analysis:
- Bollinger Bands: The stock price has been trading near the upper Bollinger Band, suggesting an overbought condition and a possible reversal or consolidation.
Volume Analysis:
- On-Balance Volume (OBV): The OBV has been steadily increasing, indicating accumulation by investors.
- Chaikin Money Flow (CMF): The CMF has been positive, reflecting buying pressure in the stock.
Key Observations:
- The stock is currently in a strong bullish trend based on moving averages and MACD.
- Momentum indicators like RSI and Stochastic Oscillator suggest overbought conditions, which may lead to a potential pullback or consolidation.
- Volatility indicators point towards a possible reversal or sideways movement due to the stock trading near the upper Bollinger Band.
- Volume analysis indicates positive accumulation and buying pressure in the stock.
Conclusion:
Based on the analysis of technical indicators, the stock is likely to experience a short-term pullback or consolidation in the coming days due to overbought conditions indicated by momentum indicators and proximity to the upper Bollinger Band. Traders should exercise caution and consider taking profits or implementing risk management strategies. However, the overall trend remains bullish, so any pullback could present a buying opportunity for long-term investors.