Technical Analysis of RWK 2024-05-10
Overview:
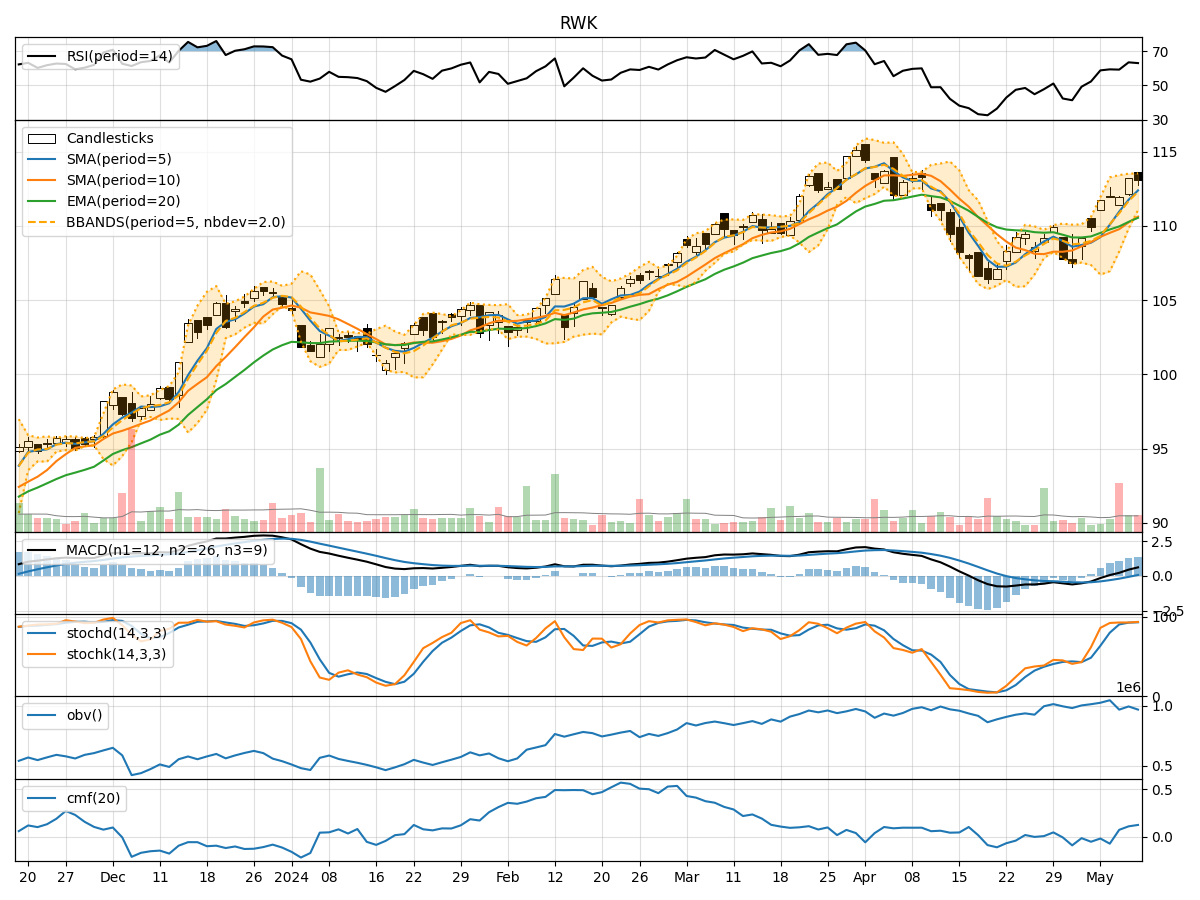
In the last 5 trading days, RWK stock has shown a consistent uptrend in price, supported by increasing volume. The moving averages (MA) have been trending upwards, indicating a bullish sentiment. Momentum indicators like RSI and Stochastic oscillators suggest the stock is in overbought territory. Volatility indicators show narrowing Bollinger Bands, indicating a potential decrease in volatility. Volume indicators like OBV and CMF suggest accumulation by investors.
Trend Analysis:
- Moving Averages (MA): The 5-day MA has been consistently above the 10-day SMA, indicating a short-term bullish trend. The EMA(20) has been steadily rising, supporting the uptrend in price.
- MACD: The MACD line has been above the signal line for the past few days, indicating bullish momentum.
- Conclusion: The trend indicators suggest a strong bullish sentiment in the stock price.
Momentum Analysis:
- RSI: The RSI has been in the overbought zone, indicating a potential reversal or consolidation in the near future.
- Stochastic Oscillators: Both %K and %D have been in the overbought region, suggesting a possible pullback.
- Conclusion: Momentum indicators signal a potential short-term correction or consolidation in the stock price.
Volatility Analysis:
- Bollinger Bands (BB): The narrowing of the Bollinger Bands suggests decreasing volatility and a potential period of consolidation.
- Conclusion: Volatility indicators point towards a period of consolidation in the stock price.
Volume Analysis:
- On-Balance Volume (OBV): The OBV has been trending upwards, indicating accumulation by investors.
- Chaikin Money Flow (CMF): The CMF has been positive, suggesting buying pressure in the stock.
- Conclusion: Volume indicators support the bullish sentiment in the stock.
Overall Conclusion:
Based on the analysis of technical indicators, the next few days in RWK stock are likely to see a short-term correction or consolidation due to overbought conditions indicated by momentum indicators like RSI and Stochastic oscillators. However, the overall trend remains bullish supported by moving averages and volume indicators. Traders may consider taking profits or waiting for a pullback before entering new positions. It is essential to monitor price action closely for any signs of a reversal or continuation of the current uptrend.