Technical Analysis of SARK 2024-05-10
Overview:
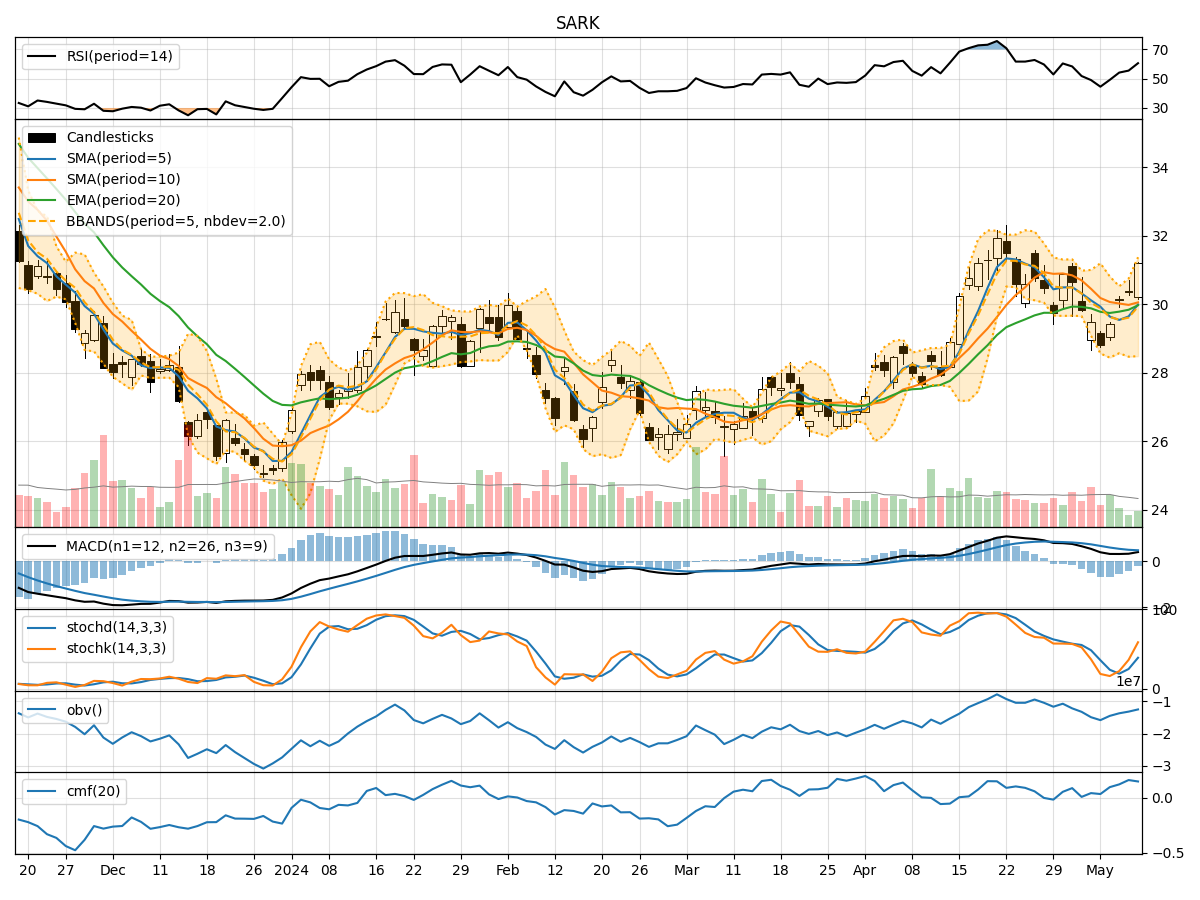
In analyzing the technical indicators for SARK stock over the last 5 days, we will delve into the trend, momentum, volatility, and volume indicators to provide a comprehensive outlook on the possible stock price movement in the coming days. By examining these key indicators, we aim to offer valuable insights and predictions to guide investment decisions.
Trend Indicators:
- Moving Averages (MA): The 5-day moving average (MA) has been fluctuating around the stock price, indicating short-term price trends. The Simple Moving Average (SMA) and Exponential Moving Average (EMA) show a slight divergence, suggesting potential price volatility.
- MACD: The Moving Average Convergence Divergence (MACD) has been positive, indicating bullish momentum. However, the MACD Histogram has been decreasing, signaling a potential slowdown in the uptrend.
Momentum Indicators:
- RSI: The Relative Strength Index (RSI) has been gradually increasing, reaching the overbought territory above 70. This could imply a potential reversal or consolidation in the stock price.
- Stochastic Oscillator: Both %K and %D have been rising, indicating increasing buying pressure. However, the stock is approaching the overbought zone, suggesting a possible pullback.
Volatility Indicators:
- Bollinger Bands: The Bollinger Bands have been widening, indicating increased price volatility. The current price is close to the upper band, suggesting a potential overbought condition.
- Bollinger %B: The %B indicator is above 0.8, indicating a relatively high price compared to the recent past. This could signal a potential reversal or correction.
Volume Indicators:
- On-Balance Volume (OBV): The OBV has been steadily increasing, reflecting positive buying volume. This could support the current uptrend in the stock price.
- Chaikin Money Flow (CMF): The CMF has been positive, indicating money flow into the stock. This suggests underlying strength in the buying pressure.
Key Observations and Opinions:
- Trend: The trend indicators suggest a mixed outlook with potential volatility in the short term. The MACD signals a bullish trend, but the MACD Histogram indicates a possible slowdown.
- Momentum: The momentum indicators show overbought conditions, signaling a potential reversal or consolidation in the stock price.
- Volatility: Increasing volatility, as indicated by the widening Bollinger Bands, could lead to price fluctuations and possible corrections.
- Volume: Strong buying volume, as seen in the OBV and CMF, supports the current uptrend but also raises concerns about overbought conditions.
Conclusion:
Based on the analysis of the technical indicators, the stock price of SARK is likely to experience a short-term pullback or consolidation in the coming days. The overbought conditions, coupled with increasing volatility, suggest a potential correction in the stock price. Traders may consider taking profits or implementing risk management strategies to navigate the expected price movements. It is advisable to closely monitor the price action and key support levels for potential entry or exit points.