Technical Analysis of SBIO 2024-05-31
Overview:
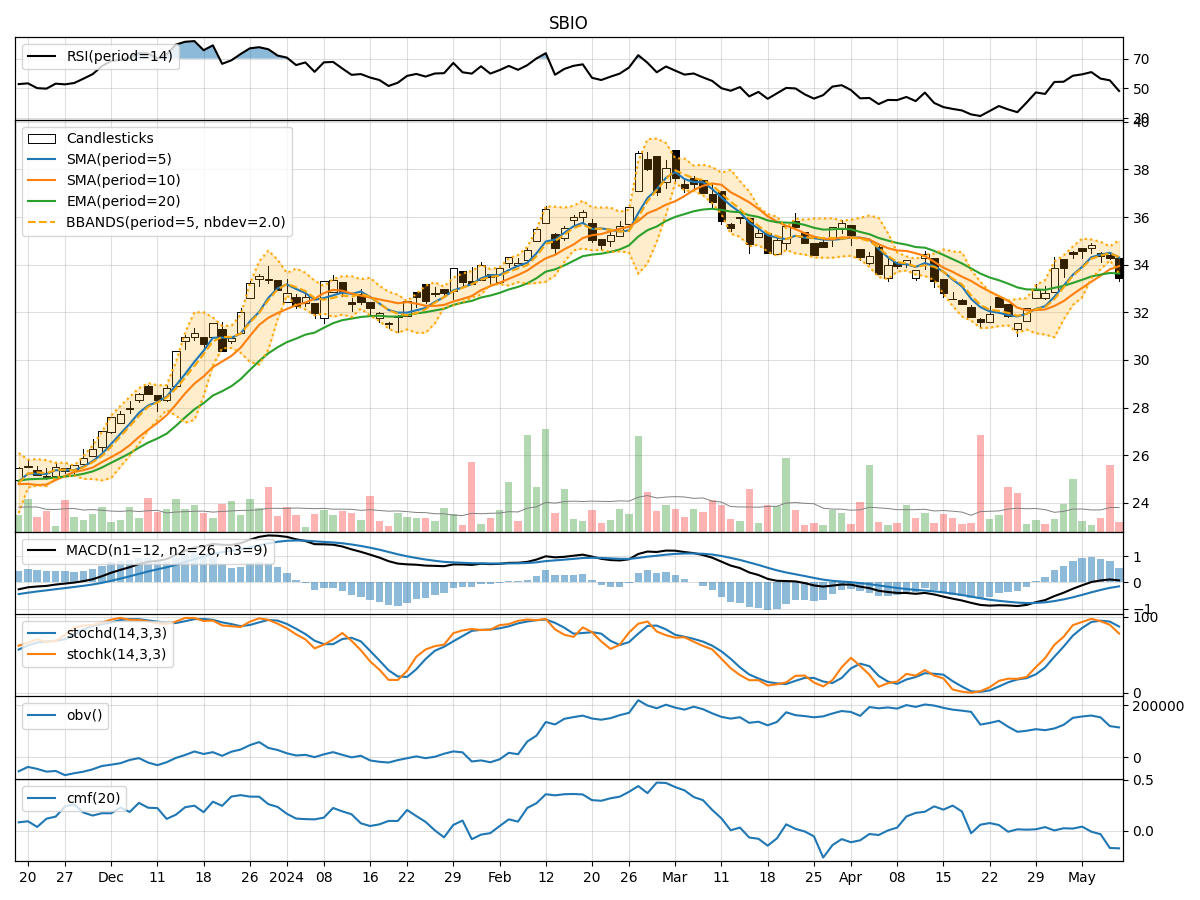
In analyzing the technical indicators for SBIO over the last 5 days, we will delve into the trend, momentum, volatility, and volume indicators to provide a comprehensive outlook on the possible stock price movement in the coming days.
Trend Analysis:
- Moving Averages (MA): The 5-day MA has been consistently below the closing price, indicating a short-term bearish trend.
- MACD: The MACD line has been below the signal line, suggesting a bearish momentum.
- RSI: The RSI has been fluctuating around the 50 level, indicating indecision in the market.
Momentum Analysis:
- Stochastic Oscillator: The stochastic indicators have been showing oversold conditions, hinting at a potential reversal.
- Williams %R: The Williams %R has been in oversold territory, signaling a possible buying opportunity.
Volatility Analysis:
- Bollinger Bands (BB): The stock price has been trading within the lower Bollinger Band, indicating a potential oversold condition.
- BB Width: The Bollinger Band width has been narrowing, suggesting a decrease in volatility.
Volume Analysis:
- On-Balance Volume (OBV): The OBV has shown mixed signals, with some days indicating distribution and others accumulation.
- Chaikin Money Flow (CMF): The CMF has been hovering around the zero line, indicating a balance between buying and selling pressure.
Key Observations:
- The trend indicators suggest a bearish sentiment in the short term.
- Momentum indicators show potential for a reversal from oversold conditions.
- Volatility indicators point towards a decrease in volatility.
- Volume indicators reflect mixed signals with no clear direction.
Conclusion:
Based on the analysis of the technical indicators, the next few days for SBIO could see sideways consolidation with a potential for a bullish reversal. Traders should closely monitor the stochastic indicators for confirmation of a reversal and keep an eye on the RSI for any signs of a shift in momentum. Additionally, watching the OBV for a clear accumulation or distribution pattern could provide further insights into the stock's price movement. Overall, a cautious approach with a bullish bias is recommended for the upcoming trading sessions.