Technical Analysis of SBND 2024-05-10
Overview:
In analyzing the technical indicators for SBND over the last 5 days, we will delve into the trend, momentum, volatility, and volume indicators to provide a comprehensive outlook on the possible stock price movement. By examining these key indicators, we aim to offer valuable insights and predictions for the upcoming days.
Trend Analysis:
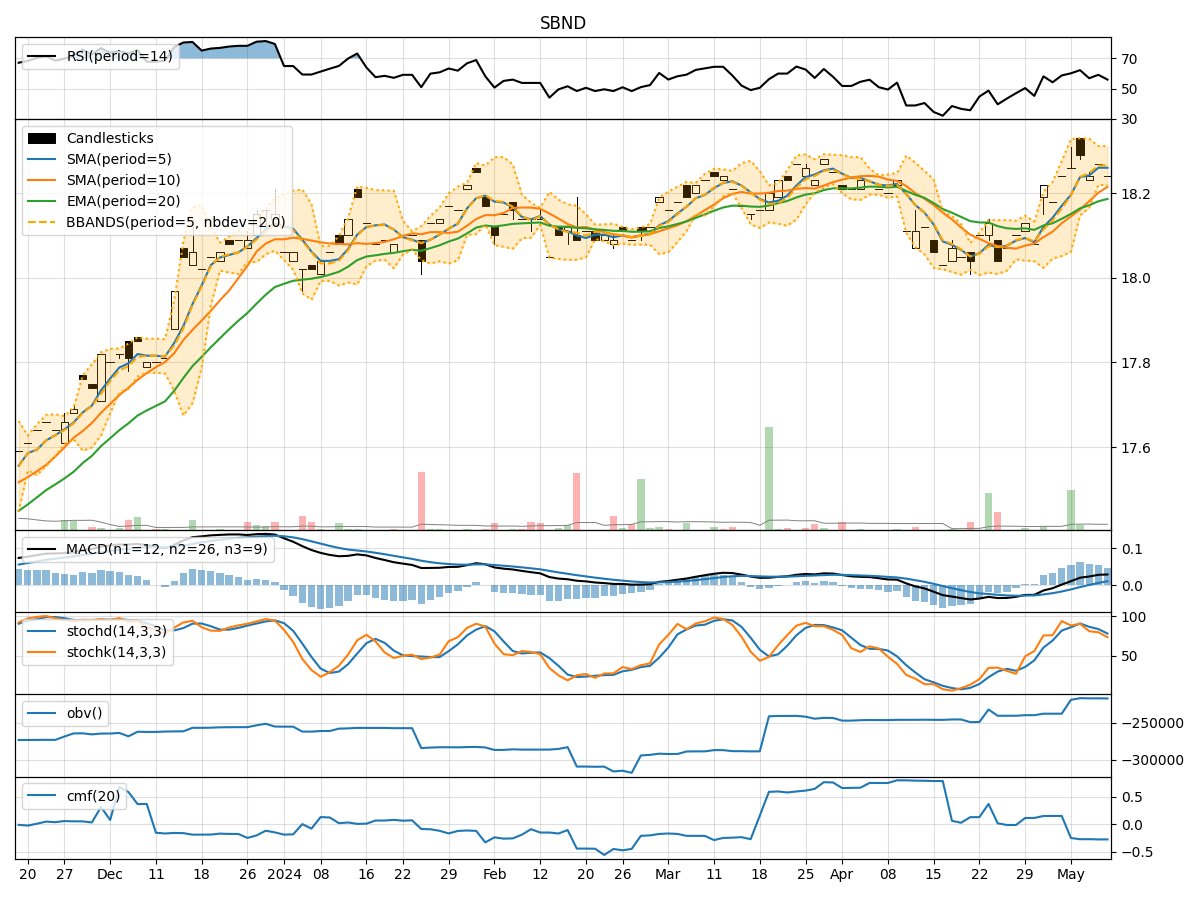
- Moving Averages (MA): The 5-day Moving Average (MA) has been consistently above the Simple Moving Average (SMA) and Exponential Moving Average (EMA), indicating a short-term bullish trend.
- MACD: The MACD line has been consistently above the signal line, with both lines showing an upward trend, suggesting bullish momentum.
- RSI: The Relative Strength Index (RSI) has been fluctuating around the 50 level, indicating a neutral stance in terms of momentum.
Momentum Analysis:
- Stochastic Oscillator: The Stochastic Oscillator has been gradually decreasing, moving towards the oversold territory, signaling a potential reversal in momentum.
- Williams %R: The Williams %R indicator has been consistently in the oversold region, suggesting a possible buying opportunity.
Volatility Analysis:
- Bollinger Bands: The Bollinger Bands have been narrowing, indicating decreasing volatility and a potential period of consolidation.
- Volatility Indicators: The volatility indicators show a decreasing trend, suggesting a stabilization in price movements.
Volume Analysis:
- On-Balance Volume (OBV): The OBV has been relatively stable, indicating a balance between buying and selling pressure.
- Chaikin Money Flow (CMF): The CMF has been negative, reflecting a lack of strong buying interest in the stock.
Key Observations:
- The trend indicators suggest a short-term bullish bias, supported by the MACD and moving averages.
- Momentum indicators show a potential reversal in momentum, with the Stochastic Oscillator nearing oversold levels.
- Volatility indicators point towards a period of consolidation and decreased price fluctuations.
- Volume indicators indicate a lack of significant buying interest, as reflected by the negative CMF.
Conclusion:
Based on the analysis of the technical indicators, the next few days for SBND could see sideways movement with a slight downward bias. While the trend remains bullish in the short term, the momentum indicators suggest a possible shift in sentiment towards a more neutral stance. The decreasing volatility and lack of strong buying interest indicated by volume indicators further support the view of a consolidation phase. Traders may consider exercising caution and monitoring key support levels for potential entry points.