Technical Analysis of SCO 2024-05-03
Overview:
In analyzing the technical indicators for SCO over the last 5 days, we will delve into the trend, momentum, volatility, and volume indicators to provide a comprehensive outlook on the possible stock price movement in the coming days. By examining these key aspects, we aim to offer valuable insights and recommendations for potential investors.
Trend Analysis:
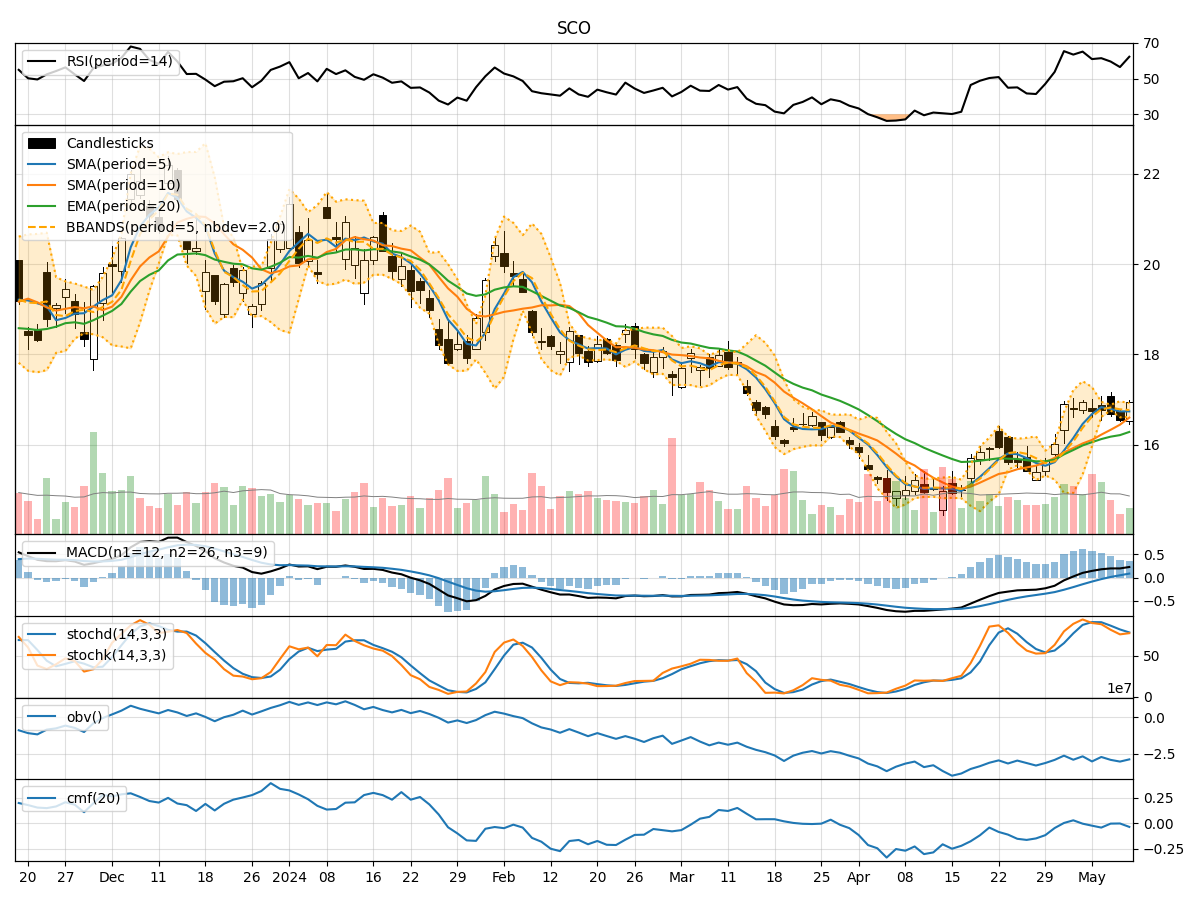
- Moving Averages (MA): The 5-day Moving Average (MA) has been showing an upward trend, indicating a positive momentum in the stock price.
- MACD: The Moving Average Convergence Divergence (MACD) has been consistently increasing, suggesting a strengthening bullish trend.
- RSI: The Relative Strength Index (RSI) has been trending upwards, reflecting increasing buying pressure in the stock.
Momentum Analysis:
- Stochastic Oscillator: Both %K and %D values of the Stochastic Oscillator have been rising, indicating strong bullish momentum.
- Williams %R: The Williams %R indicator has been hovering in the oversold territory, potentially signaling a reversal in the stock price.
Volatility Analysis:
- Bollinger Bands (BB): The Bollinger Bands have been widening, suggesting increased volatility in the stock price.
- BB %B: The %B indicator has been fluctuating within a moderate range, indicating potential price reversals.
Volume Analysis:
- On-Balance Volume (OBV): The OBV indicator has been fluctuating, reflecting mixed buying and selling pressure in the stock.
- Chaikin Money Flow (CMF): The CMF has been oscillating around the zero line, indicating a balance between buying and selling pressure.
Key Observations:
- The trend indicators suggest a bullish sentiment in the stock, supported by the positive MACD and RSI trends.
- Momentum indicators indicate strong buying momentum, especially highlighted by the rising Stochastic %K and %D values.
- Volatility indicators point towards increased price fluctuations, potentially leading to both upside and downside movements.
- Volume indicators show mixed signals, with the OBV reflecting indecision among market participants.
Conclusion:
Based on the analysis of the technical indicators, the next few days' possible stock price movement for SCO is bullish. The overall trend, momentum, and certain volatility indicators support a positive outlook for the stock. Investors may consider taking long positions or holding onto existing positions to potentially benefit from the expected upward movement in the stock price. However, it is essential to monitor the indicators closely for any signs of reversal or increased volatility in the market.