Technical Analysis of SDCP 2024-05-10
Overview:
In analyzing the technical indicators for SDCP over the last 5 days, we will delve into the trend, momentum, volatility, and volume indicators to provide a comprehensive outlook on the possible stock price movement in the coming days. By examining these key aspects, we aim to offer valuable insights and predictions to guide your investment decisions.
Trend Indicators:
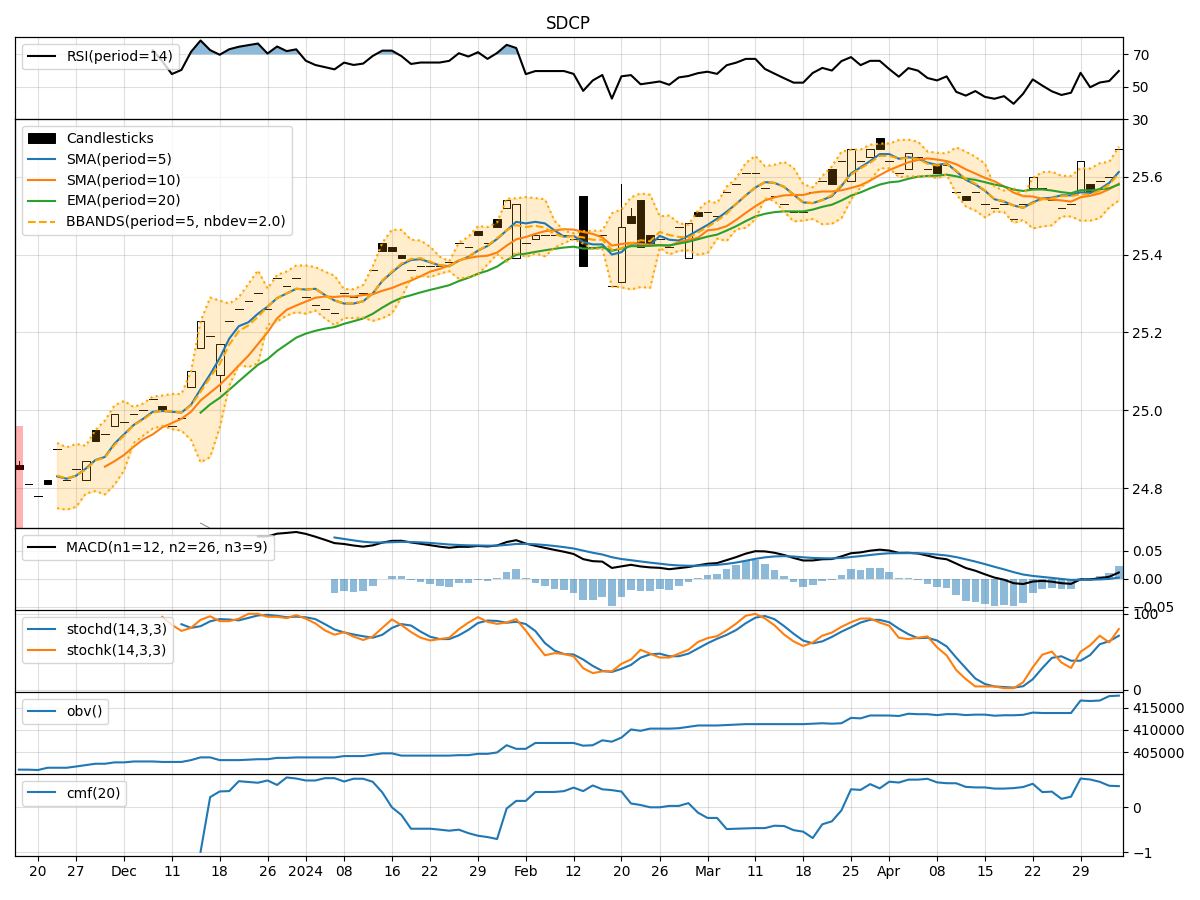
- Moving Averages (MA): The 5-day MA has been consistently above the closing price, indicating a short-term uptrend.
- MACD: The MACD line has been above the signal line, suggesting bullish momentum.
- EMA: The EMA has been trending upwards, supporting the bullish sentiment.
Key Observation: The trend indicators point towards an upward trend in the stock price.
Momentum Indicators:
- RSI: The RSI has been fluctuating around the 60-65 range, indicating moderate momentum.
- Stochastic Oscillator: Both %K and %D have been hovering in the overbought territory, signaling potential overvaluation.
- Williams %R: The indicator has shown occasional oversold conditions but lacks a clear trend.
Key Observation: Momentum indicators suggest a neutral to slightly bullish momentum in the stock.
Volatility Indicators:
- Bollinger Bands (BB): The stock price has mostly stayed within the bands, indicating stable volatility.
- BB Width: The width of the bands has been relatively narrow, suggesting low volatility.
- BB %B: The %B indicator has shown minor fluctuations within the bands.
Key Observation: Volatility indicators imply a low volatility environment for the stock.
Volume Indicators:
- On-Balance Volume (OBV): The OBV has shown a slight increase, reflecting positive volume flow.
- Chaikin Money Flow (CMF): The CMF has been gradually rising, indicating buying pressure.
Key Observation: Volume indicators signal moderate buying interest in the stock.
Conclusion:
Based on the analysis of trend, momentum, volatility, and volume indicators, the overall outlook for SDCP suggests a continuation of the current upward trend with moderate bullish momentum and low volatility. The volume indicators also support the positive sentiment with increasing buying interest.
Recommendation:
Considering the technical analysis and the prevailing market dynamics, it is advisable to consider holding or accumulating SDCP shares in the near term. However, it is essential to monitor the indicators closely for any signs of reversal or increased volatility.
Disclaimer:
Remember that technical analysis is not a guaranteed predictor of future price movements, and other fundamental factors can influence stock prices. It is crucial to conduct thorough research and consider multiple indicators before making investment decisions. Consulting with a financial advisor is recommended for personalized guidance tailored to your investment goals and risk tolerance level.