Technical Analysis of SDP 2024-05-10
Overview:
In analyzing the provided Technical Analysis (TA) data for SDP stock over the last 5 days, we will delve into the trend, momentum, volatility, and volume indicators to derive insights into the possible future stock price movements. By examining these key indicators, we aim to provide a comprehensive and informed prediction for the upcoming days.
Trend Indicators:
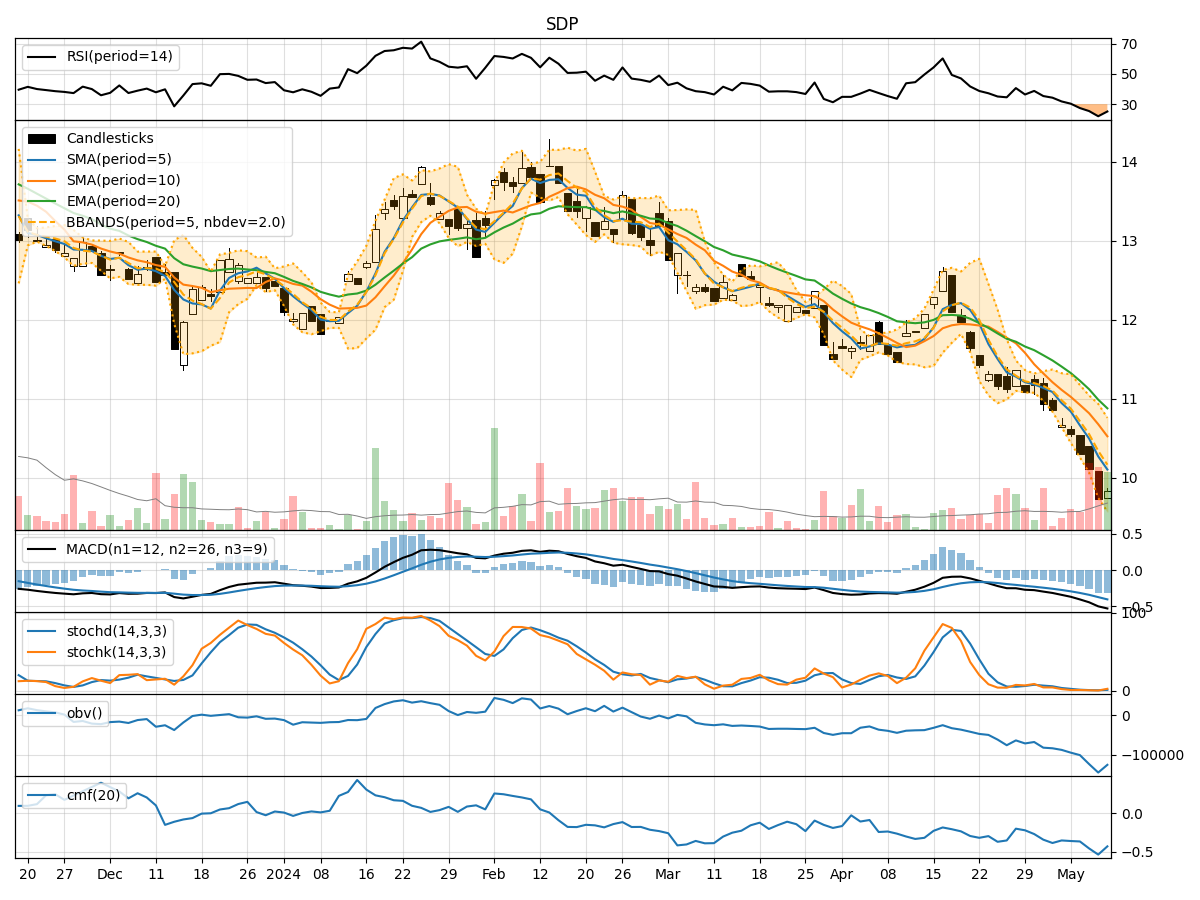
- Moving Averages (MA): The 5-day MA has been consistently declining, indicating a bearish trend in the short term.
- MACD: The MACD line has been decreasing, with the MACD histogram also showing a downward trend, signaling a bearish momentum.
- EMA: The EMA has been on a downward trajectory, further confirming the bearish sentiment in the stock.
Momentum Indicators:
- RSI: The RSI has been decreasing, suggesting that the stock is in oversold territory.
- Stochastic Oscillator: Both %K and %D have been declining, indicating a bearish momentum.
- Williams %R: The indicator is in the oversold region, signaling a potential reversal or consolidation.
Volatility Indicators:
- Bollinger Bands (BB): The stock price has been consistently below the lower Bollinger Band, indicating oversold conditions.
- Bollinger Band Width (BBW): The BBW has been widening, suggesting increased volatility in the stock.
- Bollinger Band %B (BBP): The %B is below 0.2, indicating an oversold condition.
Volume Indicators:
- On-Balance Volume (OBV): The OBV has been declining, reflecting selling pressure in the stock.
- Chaikin Money Flow (CMF): The CMF has been negative, indicating a bearish money flow trend.
Key Observations:
- The stock is currently in a bearish trend based on the moving averages and MACD indicators.
- Momentum indicators like RSI and Stochastic Oscillator suggest oversold conditions, potentially hinting at a reversal or consolidation.
- Volatility indicators show increased volatility and oversold conditions, which could lead to a potential bounce back.
- Volume indicators reflect selling pressure and bearish money flow in the stock.
Conclusion:
Based on the analysis of the technical indicators, the next few days for SDP stock are likely to see further downward movement in the stock price. The bearish trend indicated by moving averages and MACD, coupled with oversold conditions highlighted by momentum indicators, suggest a continuation of the current downtrend. However, the increased volatility and potential reversal signals from momentum indicators could lead to short-term consolidation before any significant price movement. It is advisable to closely monitor the stock for any signs of a trend reversal or a bounce back in the coming days.