Technical Analysis of SDS 2024-05-10
Overview:
In analyzing the technical indicators for SDS over the last 5 days, we will delve into the trend, momentum, volatility, and volume indicators to provide a comprehensive outlook on the possible stock price movement in the coming days. By examining these key indicators, we aim to offer valuable insights and predictions for potential trading strategies.
Trend Analysis:
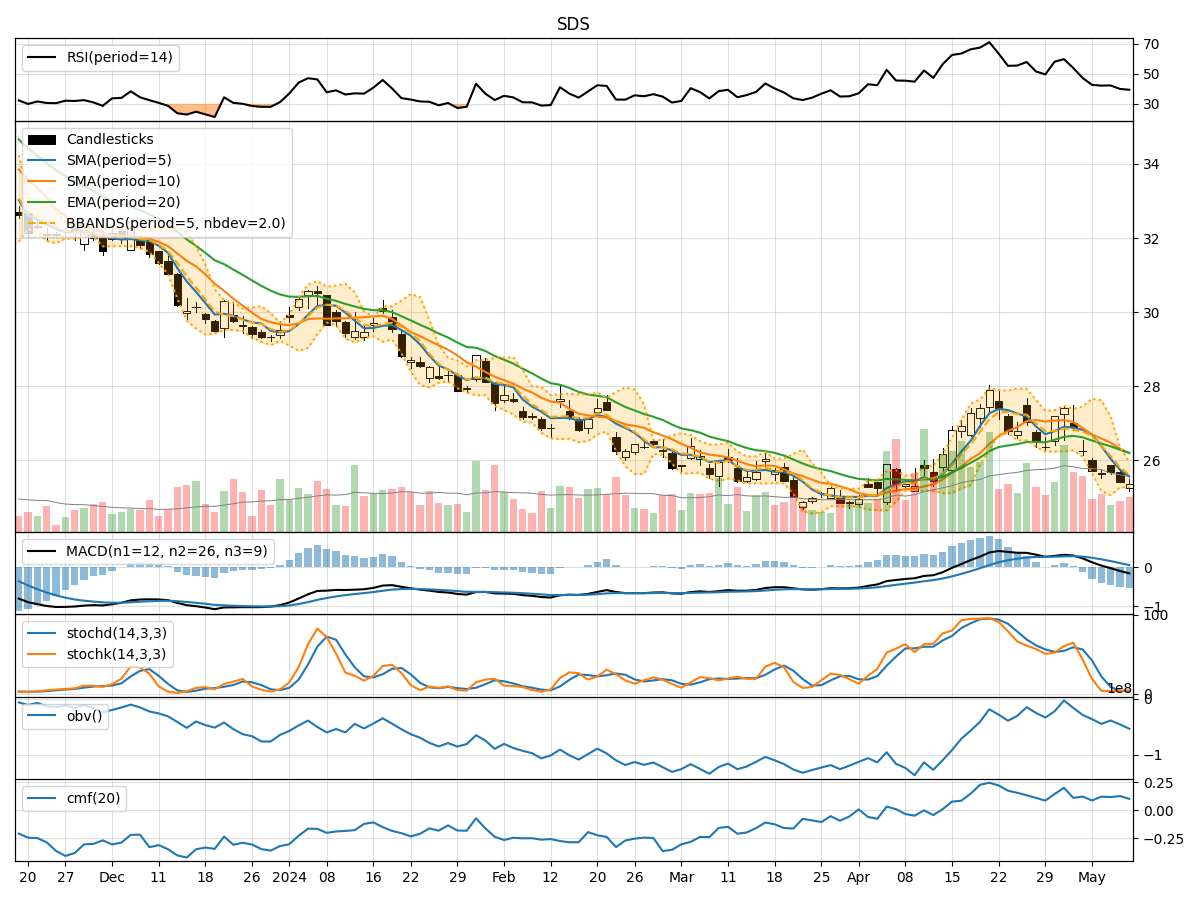
- Moving Averages (MA): The 5-day Moving Average (MA) has been consistently below the Simple Moving Average (SMA) and Exponential Moving Average (EMA), indicating a downward trend.
- MACD: The MACD line has been below the signal line, with the MACD Histogram showing negative values, suggesting bearish momentum.
Momentum Analysis:
- RSI: The Relative Strength Index (RSI) has been below 50, indicating bearish momentum in the stock.
- Stochastic Oscillator: Both %K and %D have been in oversold territory, signaling a potential reversal or continuation of the downtrend.
Volatility Analysis:
- Bollinger Bands (BB): The stock price has been consistently trading below the lower Bollinger Band, indicating oversold conditions.
- Bollinger Band Width (BBW): The BBW has been narrowing, suggesting a potential decrease in volatility.
Volume Analysis:
- On-Balance Volume (OBV): The OBV has been declining, indicating selling pressure in the stock.
- Chaikin Money Flow (CMF): The CMF has been positive but trending downwards, reflecting weakening buying pressure.
Key Observations and Opinions:
- Trend: The stock is in a clear downtrend based on moving averages and MACD analysis.
- Momentum: Bearish momentum is evident with RSI below 50 and stochastic indicators in oversold territory.
- Volatility: The stock is currently oversold according to Bollinger Bands, with decreasing volatility.
- Volume: Selling pressure is increasing as seen in the declining OBV and weakening CMF.
Conclusion:
Based on the technical indicators and analysis: - The stock is likely to continue its downward movement in the coming days. - Traders should exercise caution and consider shorting or staying on the sidelines until signs of a reversal or consolidation emerge. - It is advisable to closely monitor key support levels and wait for bullish confirmation before considering long positions.
Disclaimer:
Remember that technical analysis is not foolproof and should be used in conjunction with other forms of analysis. Market conditions can change rapidly, so it's essential to stay informed and adapt your strategies accordingly.