Technical Analysis of SDSI 2024-05-10
Overview:
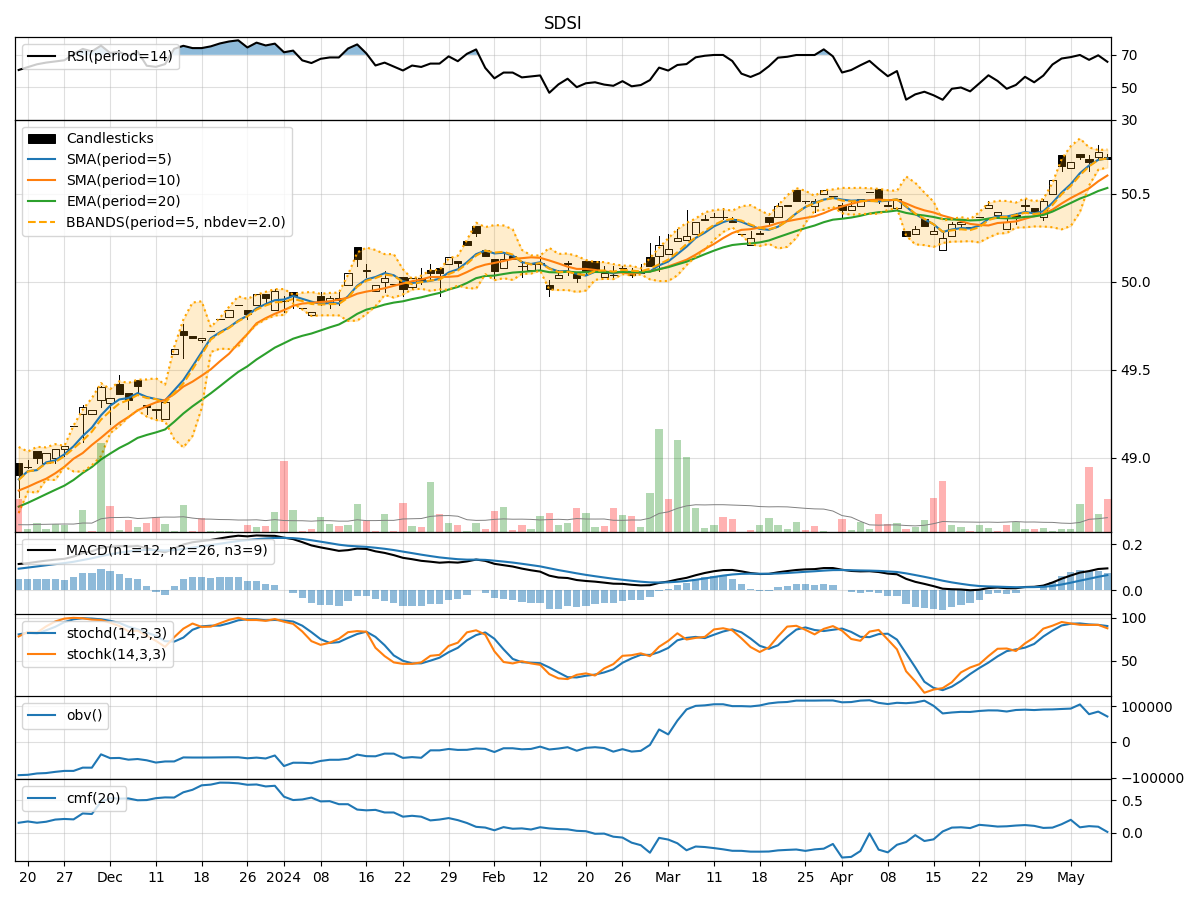
In analyzing the technical indicators for SDSI over the last 5 days, we will delve into the trend, momentum, volatility, and volume indicators to provide a comprehensive assessment of the stock's potential price movement. By examining these key factors, we aim to offer valuable insights and predictions for the next few days.
Trend Indicators:
- Moving Averages (MA): The 5-day MA has been consistently above the closing price, indicating a short-term uptrend.
- MACD: The MACD line has been trending upwards, with the MACD histogram also showing positive values, suggesting bullish momentum.
- EMA: The EMA has been steadily increasing, reflecting a positive trend in the stock price.
Momentum Indicators:
- RSI: The RSI has been fluctuating around the overbought territory, indicating strong buying pressure.
- Stochastic Oscillator: Both %K and %D have been relatively high, suggesting the stock is in overbought territory.
- Williams %R: The indicator has been consistently in the oversold region, signaling a potential reversal.
Volatility Indicators:
- Bollinger Bands: The stock price has been trading within the bands, indicating moderate volatility.
- Bollinger %B: The %B indicator has been fluctuating within a moderate range, suggesting no extreme price movements.
Volume Indicators:
- On-Balance Volume (OBV): The OBV has shown mixed signals, with no clear trend in volume accumulation.
- Chaikin Money Flow (CMF): The CMF has been positive but declining, indicating weakening buying pressure.
Key Observations:
- The trend indicators suggest a bullish sentiment in the short term, supported by the moving averages and MACD.
- Momentum indicators point towards overbought conditions, which may lead to a potential pullback or consolidation.
- Volatility remains moderate, with no significant price spikes or drops expected.
- Volume indicators show mixed signals, indicating uncertainty in market participation.
Conclusion:
Based on the analysis of the technical indicators, the next few days for SDSI are likely to see consolidation or a minor pullback due to the overbought conditions highlighted by the momentum indicators. While the trend remains upward, caution is advised as the stock may enter a period of sideways movement before resuming its uptrend. Traders should closely monitor key support and resistance levels for potential entry or exit points.