Technical Analysis of SJB 2024-05-10
Overview:
In analyzing the technical indicators for SJB stock over the last 5 days, we will delve into the trend, momentum, volatility, and volume indicators to provide a comprehensive outlook on the possible future stock price movement. By examining these key indicators, we aim to offer valuable insights and recommendations for potential investors.
Trend Analysis:
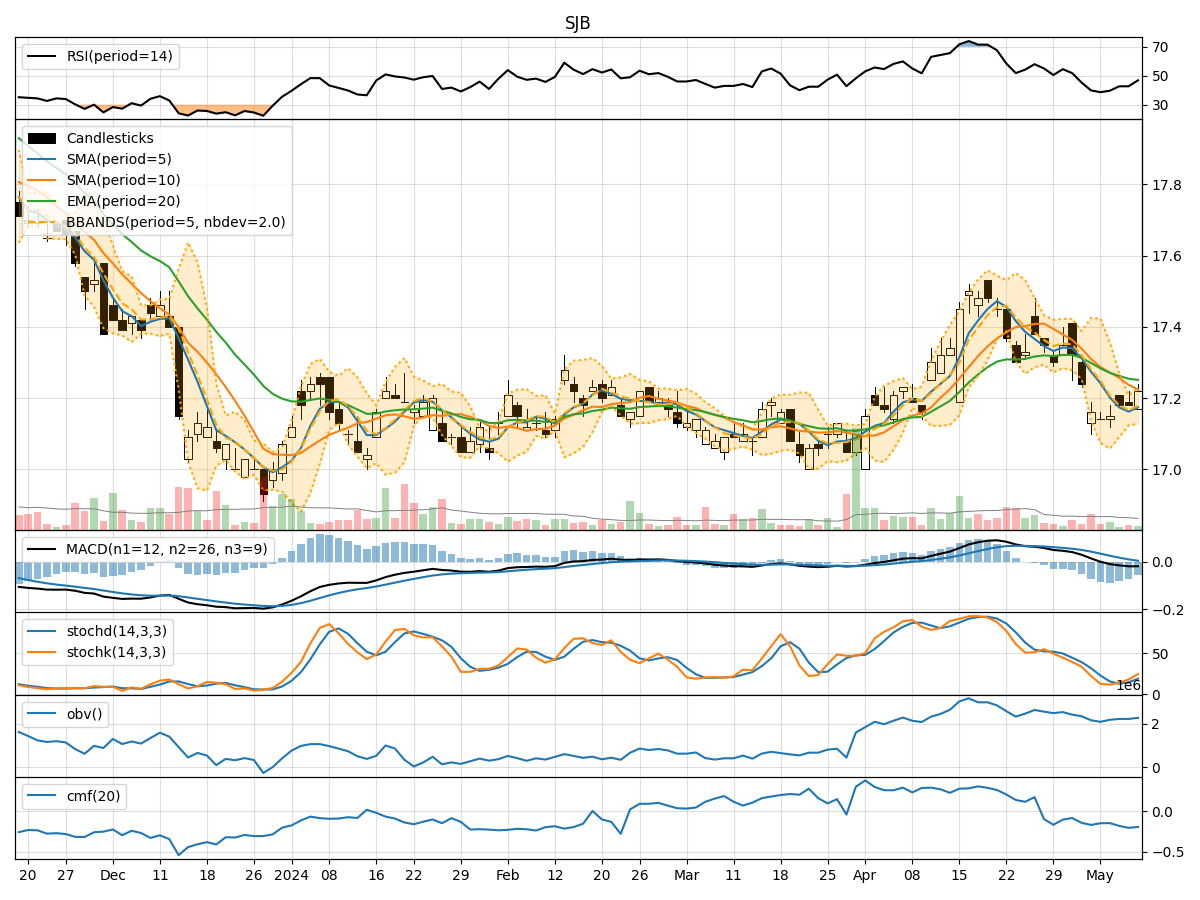
- Moving Averages (MA): The 5-day MA has been consistently below the closing prices, indicating a short-term downtrend.
- MACD: The MACD line has been below the signal line, suggesting a bearish momentum.
- EMA: The EMA has been declining, reflecting a weakening trend.
Key Observation: The trend indicators point towards a downward trend in the stock price.
Momentum Analysis:
- RSI: The RSI has been relatively low, indicating bearish momentum.
- Stochastic Oscillator: Both %K and %D have been trending downwards, signaling a bearish sentiment.
- Williams %R: The indicator has been in oversold territory, suggesting a potential reversal.
Key Observation: Momentum indicators align with a bearish outlook for the stock.
Volatility Analysis:
- Bollinger Bands (BB): The bands have been narrowing, indicating decreasing volatility.
- Bollinger %B: The %B has been hovering around 0.2-0.9, suggesting a consolidation phase.
Key Observation: Volatility indicators suggest a consolidation phase in the stock price.
Volume Analysis:
- On-Balance Volume (OBV): The OBV has been relatively flat, indicating a balance between buying and selling pressure.
- Chaikin Money Flow (CMF): The CMF has been negative, reflecting a lack of buying interest.
Key Observation: Volume indicators imply a neutral stance in terms of market participation.
Conclusion:
Based on the analysis of trend, momentum, volatility, and volume indicators, the overall outlook for SJB stock in the next few days leans towards a downward trajectory. The trend indicators, supported by momentum signals, suggest a continuation of the bearish sentiment. While volatility indicates a consolidation phase, the lackluster volume further reinforces the bearish bias.
Key Conclusion: The next few days are likely to see a downward movement in SJB stock price. Investors should exercise caution and consider potential shorting opportunities or wait for a clearer signal before entering a long position.