Technical Analysis of SMB 2024-05-10
Overview:
In analyzing the technical indicators for SMB stock over the last 5 days, we will delve into the trend, momentum, volatility, and volume indicators to provide a comprehensive outlook on the possible stock price movement in the coming days. By examining these key indicators, we aim to offer valuable insights and predictions for potential investors.
Trend Indicators:
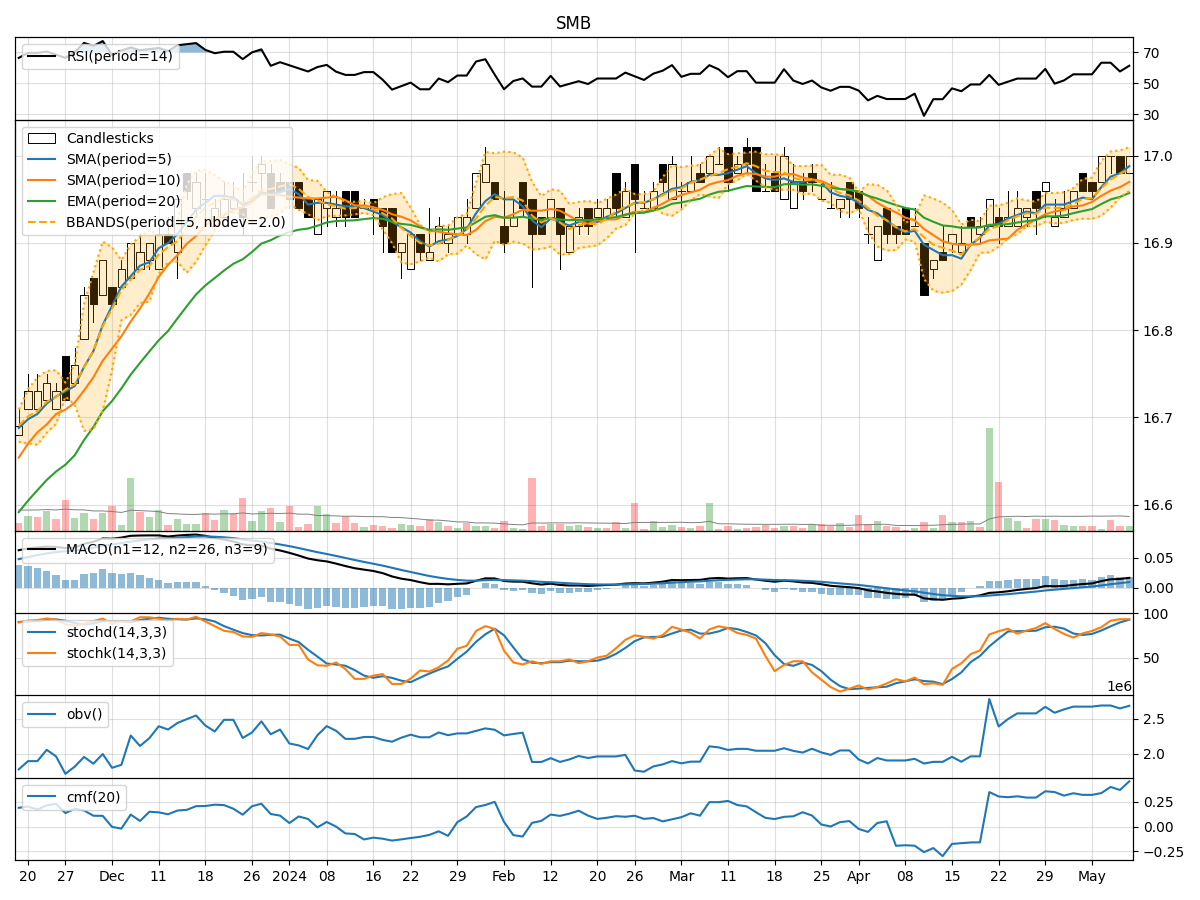
- Moving Averages (MA): The stock's closing prices have been consistently above the 5-day moving average, indicating a short-term uptrend.
- MACD: The MACD line has been consistently above the signal line, suggesting bullish momentum.
- EMA: The exponential moving average has been trending upwards, supporting the bullish sentiment.
Momentum Indicators:
- RSI: The Relative Strength Index has been fluctuating around the neutral zone, indicating a balanced momentum.
- Stochastic Oscillator: Both %K and %D have been in the overbought territory, signaling a potential reversal.
- Williams %R: The indicator has been hovering around the oversold region, suggesting a possible buying opportunity.
Volatility Indicators:
- Bollinger Bands: The stock price has been trading within the bands, indicating a period of consolidation.
- Bollinger %B: The %B value has been fluctuating around the midline, reflecting a lack of clear trend direction.
Volume Indicators:
- On-Balance Volume (OBV): The OBV has been relatively stable, indicating a balance between buying and selling pressure.
- Chaikin Money Flow (CMF): The CMF has been trending upwards, suggesting accumulation by investors.
Key Observations and Opinions:
- Trend: The stock is currently in an upward trend supported by moving averages and MACD.
- Momentum: Momentum indicators show a mixed signal, with RSI indicating neutrality and stochastic oscillators hinting at a potential reversal.
- Volatility: Bollinger Bands suggest a period of consolidation, while %B reflects a lack of clear trend direction.
- Volume: Volume indicators point towards balanced buying and selling pressure, with a slight bias towards accumulation.
Conclusion:
Based on the analysis of the technical indicators, the next few days for SMB stock are likely to see sideways movement with a slight bullish bias. Investors should monitor the stochastic oscillators for a potential reversal signal and observe the OBV and CMF for any shifts in buying pressure. Overall, a cautious approach with a focus on key support and resistance levels is recommended in the current market environment.