Technical Analysis of SPBO 2024-05-10
Overview:
In analyzing the technical indicators for SPBO over the last 5 days, we will delve into the trend, momentum, volatility, and volume indicators to provide a comprehensive outlook on the possible stock price movement in the coming days. By examining these key indicators, we aim to offer valuable insights and predictions for informed decision-making.
Trend Indicators:
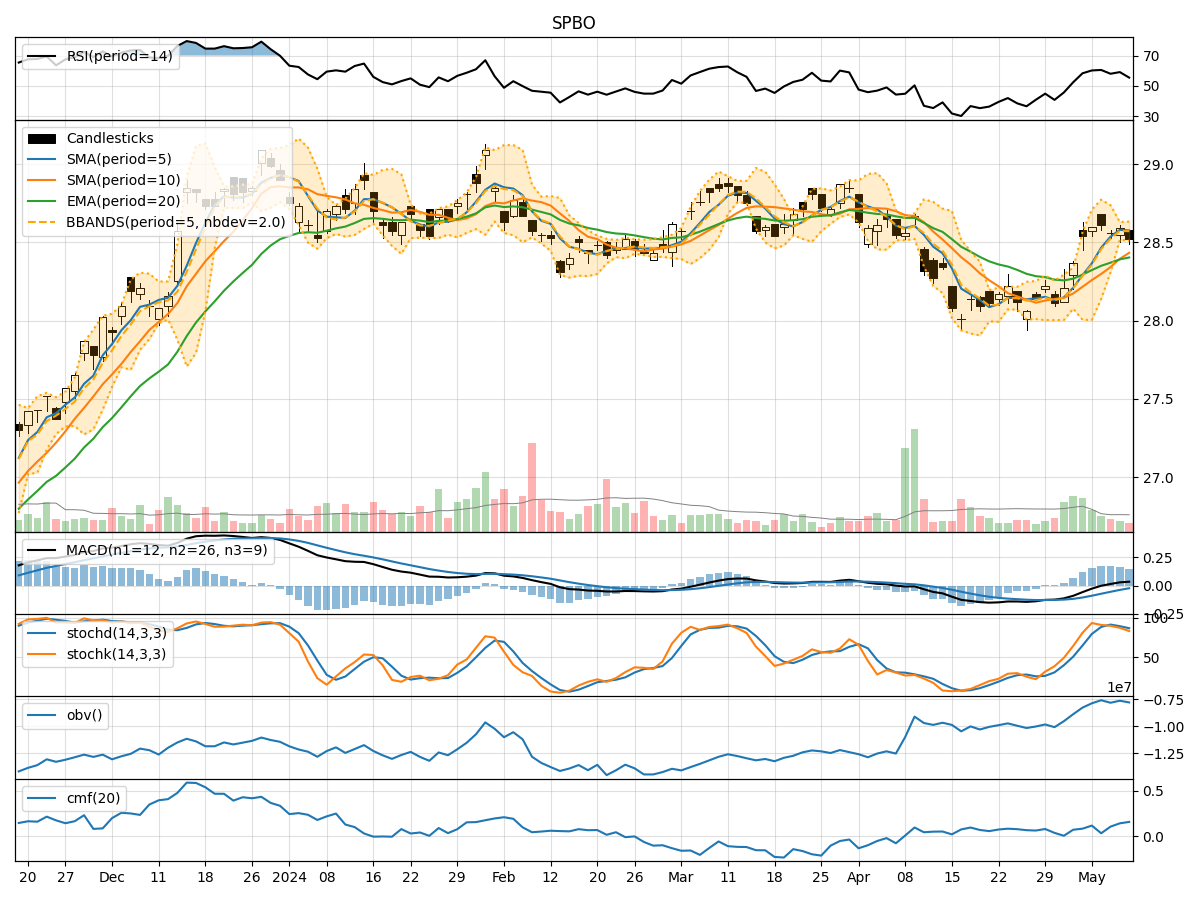
- Moving Averages (MA): The 5-day MA has been trending slightly above the simple moving average (SMA) and exponential moving average (EMA), indicating a short-term bullish trend.
- MACD: The MACD line has been consistently positive, with the MACD histogram showing an increasing trend, suggesting bullish momentum.
Momentum Indicators:
- RSI: The Relative Strength Index (RSI) has been fluctuating around the neutral zone, indicating a lack of strong momentum in either direction.
- Stochastic Oscillator: Both %K and %D have been gradually decreasing, signaling a potential bearish momentum.
Volatility Indicators:
- Bollinger Bands (BB): The stock price has been trading within the bands, with the %B indicator hovering around the middle, suggesting moderate volatility.
Volume Indicators:
- On-Balance Volume (OBV): The OBV has been relatively stable, indicating consistent buying pressure.
- Chaikin Money Flow (CMF): The CMF has been positive, reflecting a healthy inflow of money into the stock.
Key Observations:
- The trend indicators point towards a bullish sentiment in the short term.
- Momentum indicators show a lack of strong momentum, potentially leading to a consolidation phase.
- Volatility remains moderate, indicating stable price movements.
- Volume indicators suggest consistent buying interest in the stock.
Conclusion:
Based on the analysis of the technical indicators, the stock is likely to experience a period of consolidation in the coming days. The bullish trend indicated by moving averages and MACD may face resistance due to the lack of strong momentum as seen in the RSI and Stochastic Oscillator. The moderate volatility and consistent buying pressure reflected in the volume indicators support the view of a sideways movement. Investors should exercise caution and closely monitor key support and resistance levels for potential breakout opportunities.