Technical Analysis of SPLB 2024-05-10
Overview:
In analyzing the technical indicators for SPLB over the last 5 days, we will delve into the trend, momentum, volatility, and volume indicators to provide a comprehensive outlook on the possible stock price movement in the coming days. By examining these key indicators, we aim to offer valuable insights and predictions for potential investors.
Trend Analysis:
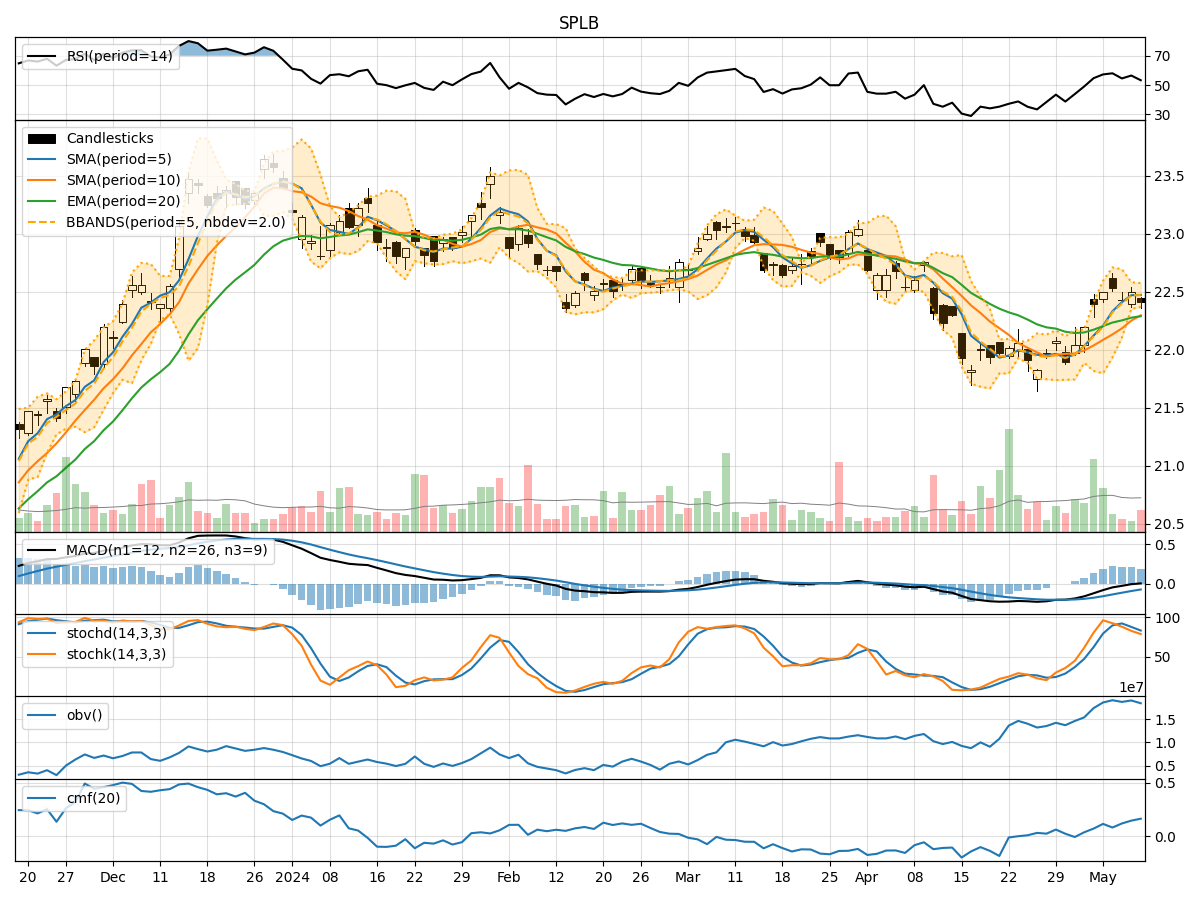
- Moving Averages (MA): The 5-day Moving Average (MA) has been consistently above the Simple Moving Average (SMA) and Exponential Moving Average (EMA), indicating a short-term bullish trend.
- MACD: The MACD line has been consistently above the signal line, suggesting positive momentum in the stock price.
- Conclusion: The trend indicators point towards an upward trend in the stock price.
Momentum Analysis:
- RSI: The Relative Strength Index (RSI) has been fluctuating around the 50 level, indicating a neutral momentum.
- Stochastic Oscillator: Both %K and %D have been decreasing, signaling a potential reversal in momentum.
- Conclusion: The momentum indicators suggest a neutral to slightly bearish sentiment in the stock price.
Volatility Analysis:
- Bollinger Bands (BB): The stock price has been trading within the Bollinger Bands, with the bands narrowing over the last few days, indicating decreasing volatility.
- Conclusion: Volatility indicators imply a consolidation phase in the stock price.
Volume Analysis:
- On-Balance Volume (OBV): The OBV has been relatively stable over the last 5 days, indicating a balance between buying and selling pressure.
- Chaikin Money Flow (CMF): The CMF has been gradually increasing, suggesting a positive inflow of money into the stock.
- Conclusion: Volume indicators reflect a neutral to slightly bullish outlook for the stock price.
Overall Conclusion:
Based on the analysis of trend, momentum, volatility, and volume indicators, the next few days' possible stock price movement for SPLB is likely to be sideways with a slight upward bias. While the trend indicators signal an upward trajectory, the momentum indicators show a neutral to bearish sentiment. The volatility indicators point towards a consolidation phase, and the volume indicators suggest a neutral to slightly bullish outlook.
Investors should closely monitor key levels such as support and resistance to gauge the stock's price action. It is advisable to wait for further confirmation from the indicators before making significant trading decisions.