Technical Analysis of SPMB 2024-05-10
Overview:
In analyzing the technical indicators for the SPMB stock over the last 5 days, we will delve into the trends, momentum, volatility, and volume indicators to provide a comprehensive outlook on the possible stock price movement in the coming days. By examining these key indicators, we aim to offer valuable insights and recommendations for potential investors.
Trend Indicators:
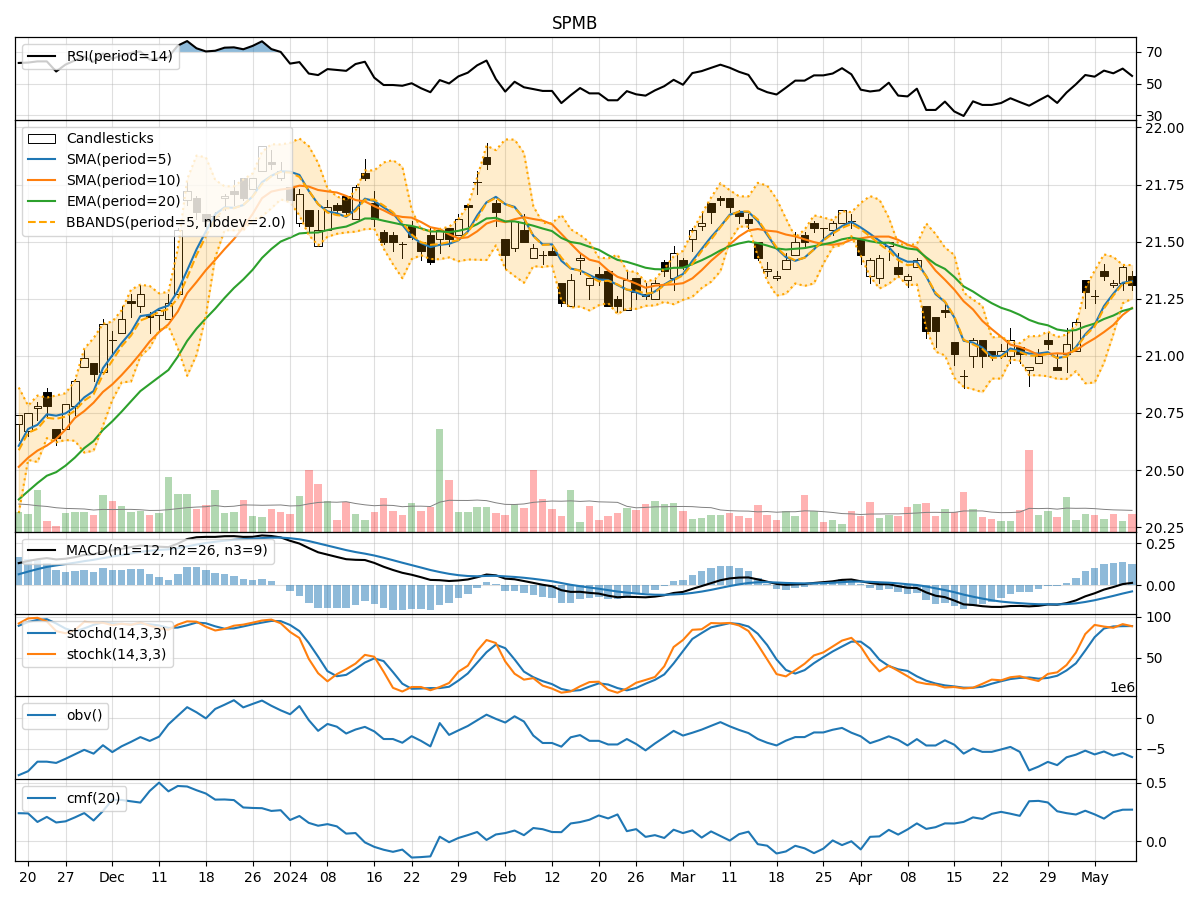
- Moving Averages (MA): The 5-day MA has been consistently above the 10-day SMA, indicating a short-term bullish trend. The EMA(20) has shown a slight upward trend, suggesting positive momentum.
- MACD: The MACD line has been above the signal line for the past few days, indicating a bullish momentum.
- MACD Histogram: The MACD histogram has been gradually increasing, signaling strengthening bullish momentum.
Momentum Indicators:
- RSI: The RSI has been fluctuating around the 50 level, indicating a neutral momentum in the stock.
- Stochastic Oscillator: Both %K and %D lines of the Stochastic Oscillator have been hovering in the overbought territory, suggesting a potential reversal or consolidation.
- Williams %R: The Williams %R has been consistently in the oversold region, indicating a potential reversal to the upside.
Volatility Indicators:
- Bollinger Bands: The stock price has been trading within the Bollinger Bands, with the bands narrowing, suggesting a period of consolidation.
- Bollinger %B: The %B indicator has been fluctuating around the midline, indicating a lack of clear direction in the stock price movement.
Volume Indicators:
- On-Balance Volume (OBV): The OBV has shown mixed signals with fluctuations in volume, indicating indecision among market participants.
- Chaikin Money Flow (CMF): The CMF has been positive, suggesting buying pressure in the stock.
Key Observations:
- The trend indicators point towards a bullish sentiment in the short term.
- Momentum indicators show a mixed picture with potential for a reversal or consolidation.
- Volatility indicators indicate a period of consolidation and indecision.
- Volume indicators suggest mixed participation from investors.
Conclusion:
Based on the analysis of the technical indicators, the next few days for SPMB stock could see sideways movement with a potential for consolidation. The stock is likely to trade within a range as investors assess the current market conditions. It is advisable to closely monitor key support and resistance levels for potential breakout opportunities.