Technical Analysis of SPSK 2024-05-10
Overview:
In analyzing the technical indicators for SPSK stock over the last 5 days, we will delve into the trend, momentum, volatility, and volume indicators to provide a comprehensive outlook on the possible future stock price movement. By examining these key indicators, we aim to offer valuable insights and recommendations for potential investors.
Trend Analysis:
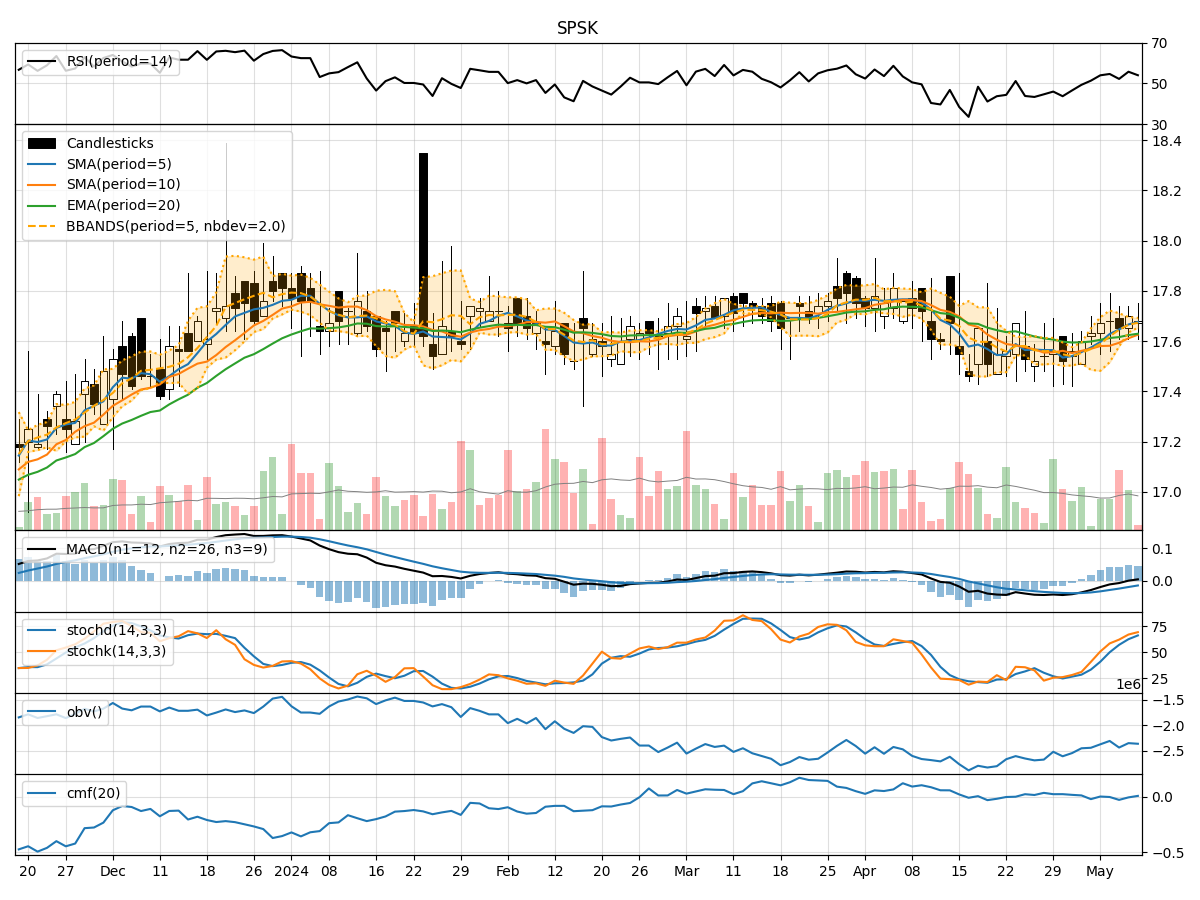
- Moving Averages (MA): The 5-day Moving Average (MA) has been showing a slight uptrend, with the stock price consistently above the MA line.
- MACD and Signal Line: The MACD has been gradually increasing, indicating a potential bullish momentum in the stock price.
- EMA: The Exponential Moving Average (EMA) has been trending upwards, suggesting a positive outlook for the stock price.
Momentum Analysis:
- RSI: The Relative Strength Index (RSI) has been fluctuating around the neutral zone, indicating a balanced momentum in the stock.
- Stochastic Oscillator: Both %K and %D lines of the Stochastic Oscillator have been rising, signaling a strengthening momentum.
- Williams %R: The Williams %R is hovering in the oversold territory, suggesting a potential buying opportunity.
Volatility Analysis:
- Bollinger Bands (BB): The Bollinger Bands have been narrowing, indicating decreasing volatility in the stock price.
- BB %B: The %B indicator is currently below 1, suggesting the stock is trading below the lower Bollinger Band.
- BB Width: The Bollinger Band Width has been contracting, indicating a potential decrease in volatility.
Volume Analysis:
- On-Balance Volume (OBV): The OBV has been fluctuating, indicating mixed buying and selling pressure in the stock.
- Chaikin Money Flow (CMF): The CMF has been negative, suggesting a slight outflow of money from the stock.
Key Observations:
- The trend indicators suggest a bullish sentiment with the moving averages and MACD pointing towards an upward trend.
- Momentum indicators show a mixed picture with RSI indicating neutrality, while Stochastic Oscillator signals a potential uptrend.
- Volatility indicators point towards decreasing volatility, which could lead to a period of consolidation.
- Volume indicators reflect mixed sentiment with OBV fluctuating and CMF slightly negative.
Conclusion:
Based on the analysis of the technical indicators, the next few days for SPSK stock are likely to see upward movement. The trend indicators, particularly the moving averages and MACD, support a bullish outlook. Momentum indicators also hint at a potential uptrend, despite some mixed signals. The decreasing volatility and mixed volume indicators suggest a period of consolidation before a possible continuation of the upward trend. Investors may consider entering long positions with appropriate risk management strategies in place.