Technical Analysis of SPTI 2024-05-10
Overview:
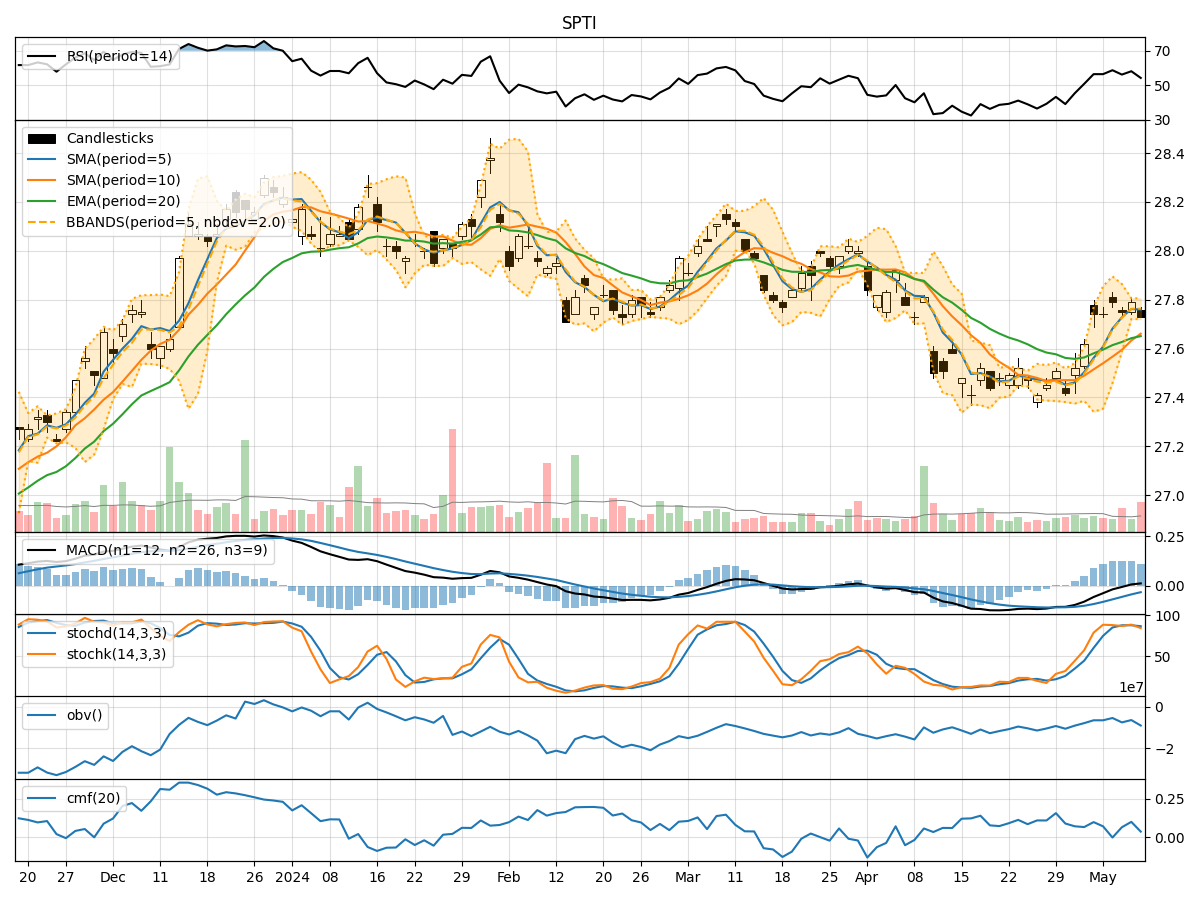
In analyzing the technical indicators for SPTI over the last 5 days, we will delve into the trends, momentum, volatility, and volume aspects to provide a comprehensive outlook on the possible stock price movement. By examining key indicators such as moving averages, MACD, RSI, Bollinger Bands, and OBV, we aim to offer valuable insights and predictions for the upcoming days.
Trend Analysis:
- Moving Averages (MA): The 5-day MA has been relatively stable around the closing prices, indicating a consistent trend.
- MACD: The MACD line has shown a slight positive trend, with the MACD histogram moving towards the zero line.
- EMA: The EMA has been gradually increasing, suggesting a bullish sentiment in the short to medium term.
Momentum Analysis:
- RSI: The RSI values have been fluctuating around the mid-range, indicating a balanced momentum without extreme overbought or oversold conditions.
- Stochastic Oscillator: Both %K and %D values have been hovering around the overbought territory, signaling a potential reversal or consolidation.
Volatility Analysis:
- Bollinger Bands: The stock price has mostly stayed within the bands, with the %B indicator showing a neutral position.
- Volatility: The volatility has been relatively low, as indicated by the narrow Bollinger Bands, suggesting a period of consolidation.
Volume Analysis:
- On-Balance Volume (OBV): The OBV values have shown mixed movements, reflecting indecision among market participants.
- Chaikin Money Flow (CMF): The CMF has been positive, indicating buying pressure in the market.
Key Observations:
- The stock has been trading within a narrow range, with indicators pointing towards a consolidation phase.
- Momentum indicators suggest a potential reversal or sideways movement in the near term.
- Volume indicators show mixed signals, reflecting uncertainty among investors.
Conclusion:
Based on the analysis of the technical indicators, the stock is likely to experience a period of consolidation in the upcoming days. The lack of clear trends in momentum, coupled with low volatility and mixed volume signals, indicates a potential sideways movement. Traders may consider adopting a neutral stance or implementing range-bound strategies until clearer signals emerge.