Technical Analysis of SPXU 2024-05-03
Overview:
In analyzing the technical indicators for SPXU over the last 5 days, we will delve into the trend, momentum, volatility, and volume indicators to provide a comprehensive outlook on the possible stock price movement in the coming days. By examining these key aspects, we aim to offer valuable insights and predictions to guide your investment decisions.
Trend Indicators:
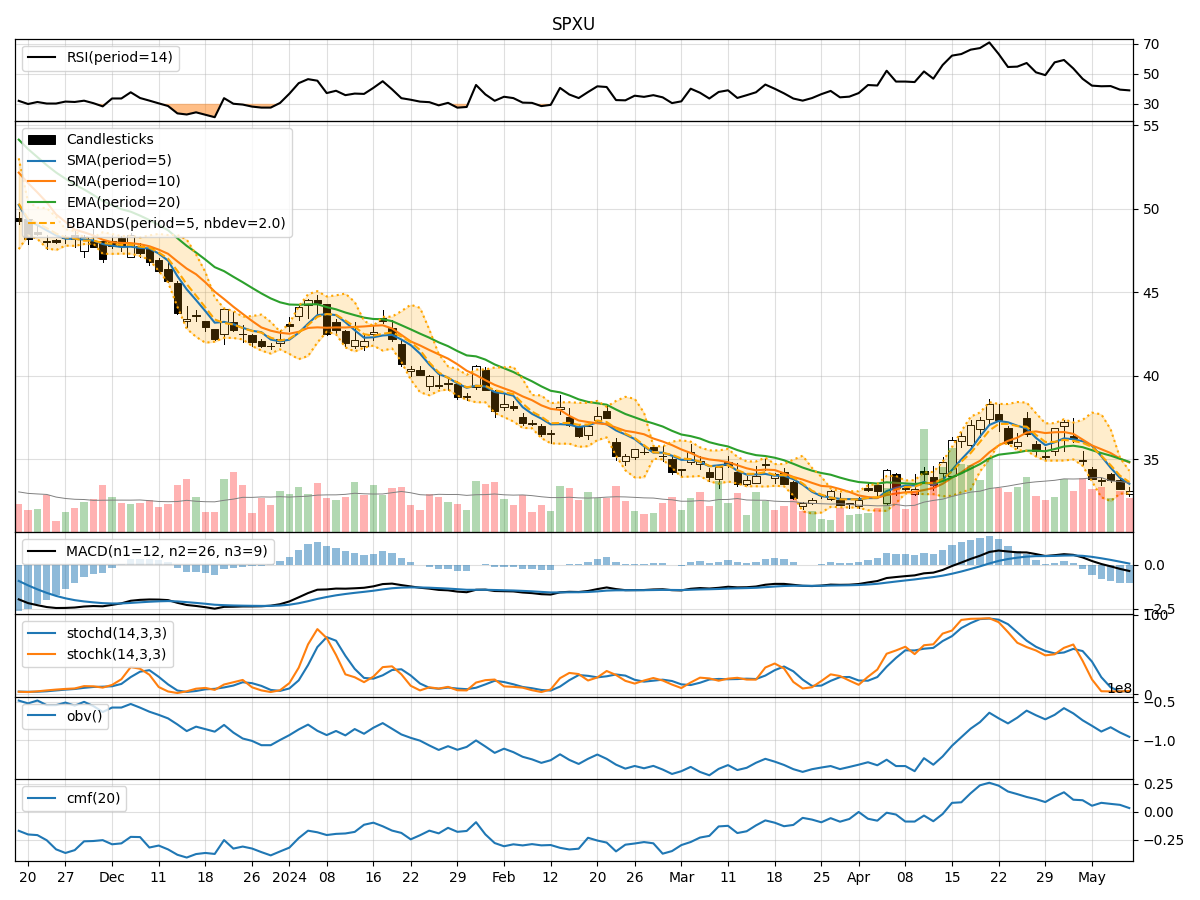
- Moving Averages (MA): The 5-day MA has been fluctuating around the closing prices, indicating short-term price trends. The Simple Moving Average (SMA) and Exponential Moving Average (EMA) show a slight downward trend, with the EMA lagging behind.
- MACD: The MACD line has been positive, indicating a potential bullish momentum, although the MACD Histogram has shown some decrease in momentum.
Momentum Indicators:
- RSI: The Relative Strength Index (RSI) has been hovering around the mid-level, suggesting a neutral stance in momentum.
- Stochastic Oscillator: Both %K and %D have shown fluctuations, with %K crossing %D multiple times, indicating indecision in momentum direction.
- Williams %R: The Williams %R has been in oversold territory, signaling a potential reversal in momentum.
Volatility Indicators:
- Bollinger Bands: The Bollinger Bands have shown narrowing, indicating decreasing volatility. The price has been trading within the bands, suggesting a period of consolidation.
- Bollinger %B: The %B indicator has been fluctuating around the mid-level, further confirming the consolidation phase.
Volume Indicators:
- On-Balance Volume (OBV): The OBV has shown mixed signals, with no clear trend in volume accumulation or distribution.
- Chaikin Money Flow (CMF): The CMF has been relatively low, indicating a lack of strong buying or selling pressure.
Key Observations and Opinions:
- Trend: The trend indicators suggest a neutral to slightly bearish outlook in the short term.
- Momentum: Momentum indicators reflect indecision and a lack of strong directional bias.
- Volatility: Volatility indicators point towards a period of consolidation and decreased price fluctuations.
- Volume: Volume indicators do not provide a clear indication of significant buying or selling pressure.
Conclusion:
Based on the analysis of the technical indicators, the next few days for SPXU are likely to see sideways movement with a slight bearish bias. The stock may continue to consolidate within a narrow range, with limited volatility and muted trading volume. Traders should exercise caution and wait for clearer signals before making significant trading decisions.