Technical Analysis of SVIX 2024-05-10
Overview:
In analyzing the technical indicators for SVIX over the last 5 days, we will delve into the trend, momentum, volatility, and volume indicators to provide a comprehensive outlook on the possible stock price movement. By examining these key aspects, we aim to offer valuable insights and predictions for the upcoming days.
Trend Indicators:
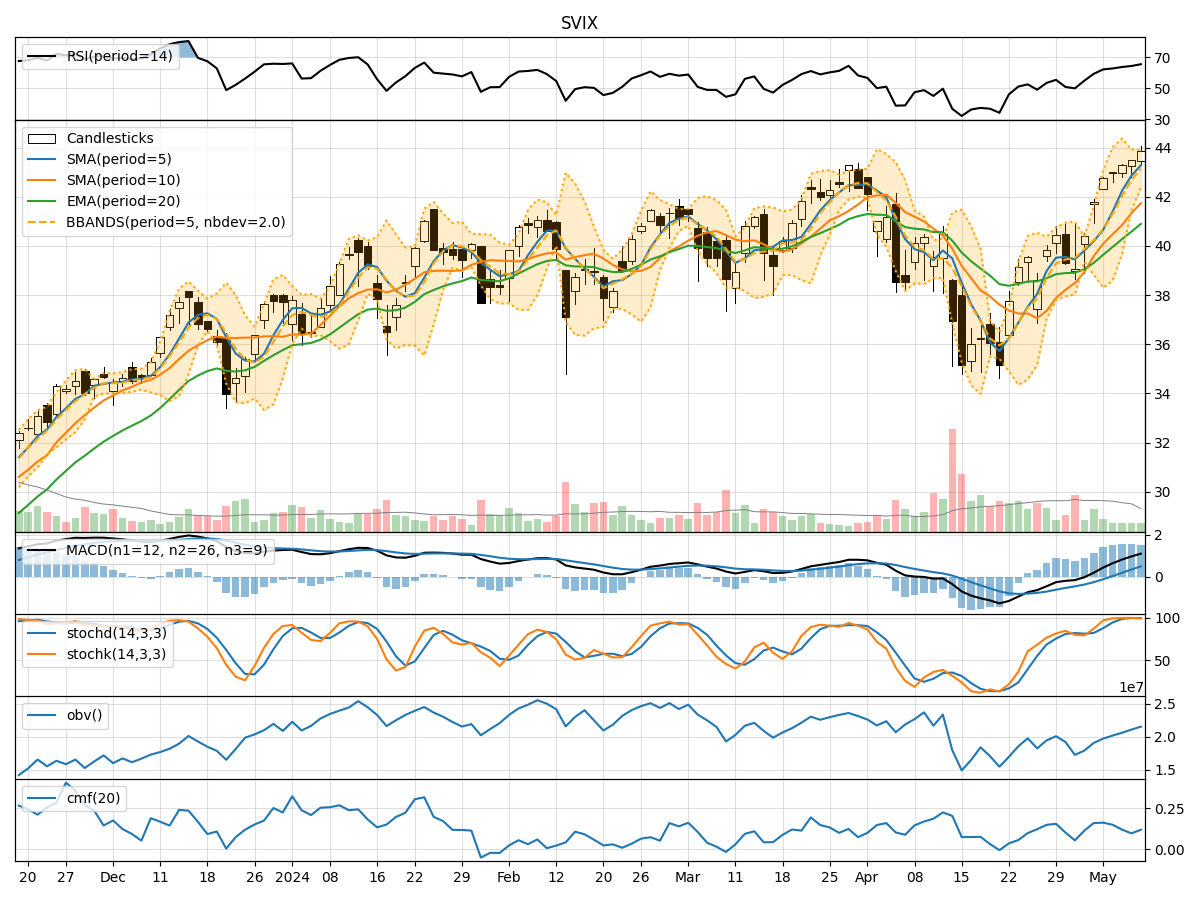
- Moving Averages (MA): The moving averages have been consistently trending upwards over the past 5 days, indicating a bullish momentum in the stock price.
- MACD (Moving Average Convergence Divergence): The MACD and its signal line have been positive and increasing, suggesting a strengthening bullish trend.
- RSI (Relative Strength Index): The RSI values have been in the overbought territory, reflecting strong buying momentum in the stock.
Momentum Indicators:
- Stochastic Oscillator: The stochastic oscillator has been in the overbought region, indicating a potential reversal or consolidation in the stock price.
- Williams %R (Willams Percentage Range): The Williams %R has been consistently in the oversold region, signaling a possible correction or pullback.
Volatility Indicators:
- Bollinger Bands: The Bollinger Bands have been widening, suggesting increased volatility in the stock price.
- Average True Range (ATR): The ATR values have been relatively stable, indicating consistent price movements without significant spikes.
Volume Indicators:
- On-Balance Volume (OBV): The OBV has been declining, indicating a divergence between price and volume, which could signal a potential trend reversal.
- Chaikin Money Flow (CMF): The CMF has been positive but decreasing, suggesting a weakening buying pressure in the stock.
Key Observations and Opinions:
- Trend: The overall trend based on moving averages and MACD is strongly bullish.
- Momentum: The momentum indicators show conflicting signals with stochastic oscillator in overbought territory and Williams %R in oversold territory, indicating a potential reversal or consolidation.
- Volatility: The widening Bollinger Bands suggest increased volatility, which could lead to larger price swings.
- Volume: The declining OBV and decreasing CMF indicate a weakening buying pressure and potential shift in market sentiment.
Conclusion:
Based on the analysis of the technical indicators, the stock price of SVIX is likely to experience increased volatility in the upcoming days. The conflicting signals from momentum indicators suggest a potential reversal or consolidation in the short term. However, the overall bullish trend indicated by moving averages and MACD signals a continuation of the upward trajectory in the medium to long term. Traders should exercise caution and closely monitor price movements for potential entry or exit points.