Technical Analysis of TFJL 2024-05-10
Overview:
In analyzing the technical indicators for TFJL stock over the last 5 days, we will delve into the trend, momentum, volatility, and volume indicators to provide a comprehensive outlook on the possible stock price movement in the coming days. By examining these key indicators, we aim to offer valuable insights and predictions for potential investors.
Trend Analysis:
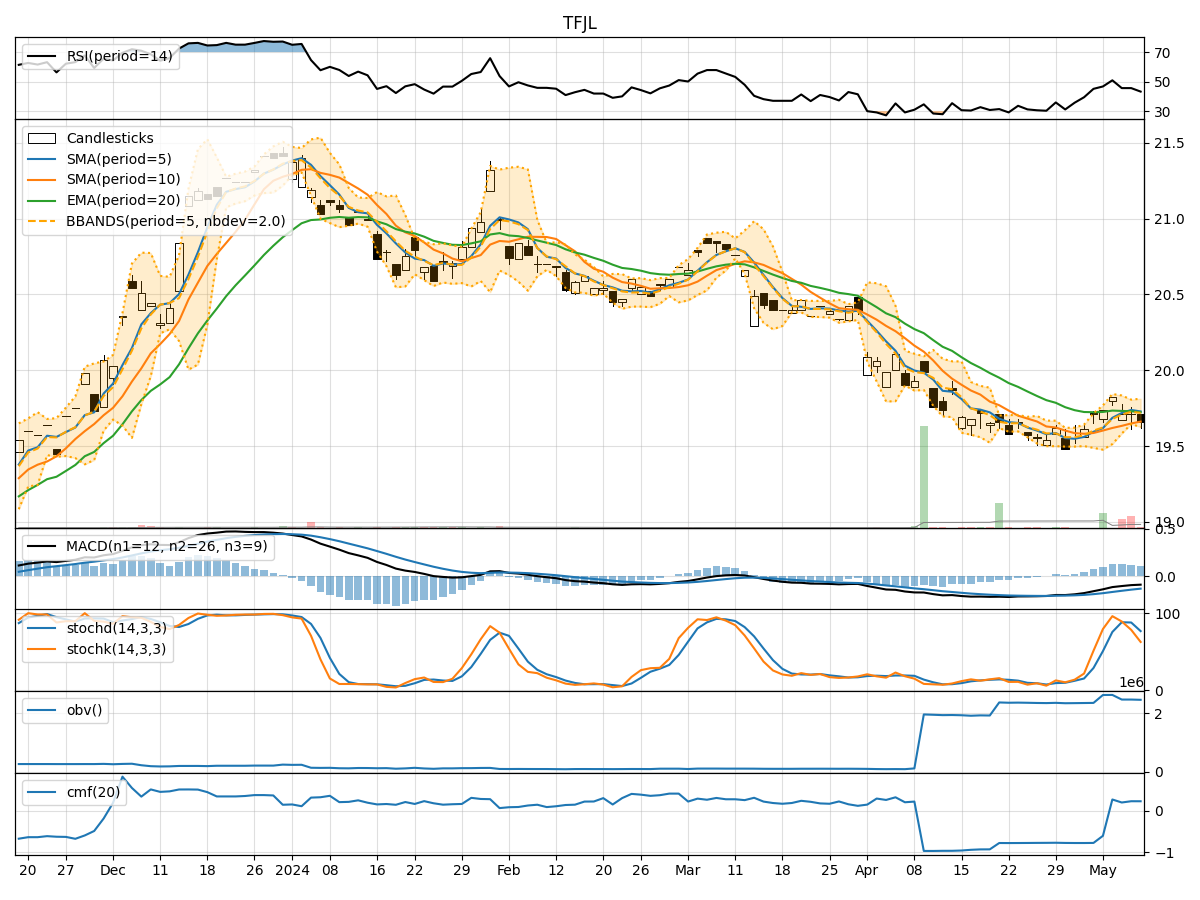
- Moving Averages (MA): The 5-day MA has been consistently above the closing price, indicating a short-term uptrend.
- MACD: The MACD line has been negative but showing signs of convergence with the signal line, suggesting a potential reversal.
- EMA: The EMA has been relatively stable, reflecting a neutral trend.
Key Observation: The trend indicators suggest a mixed outlook with a slight bullish bias.
Momentum Analysis:
- RSI: The RSI has been hovering around the 50 level, indicating a neutral momentum.
- Stochastic Oscillator: Both %K and %D have been declining, signaling a weakening momentum.
- Williams %R: The indicator has been in oversold territory, suggesting a potential reversal.
Key Observation: Momentum indicators point towards a neutral to slightly bearish sentiment.
Volatility Analysis:
- Bollinger Bands (BB): The bands have been narrowing, indicating decreasing volatility.
- Bollinger %B: The %B has been fluctuating within a tight range, reflecting stable volatility levels.
Key Observation: Volatility indicators suggest a period of consolidation and potential price stability.
Volume Analysis:
- On-Balance Volume (OBV): The OBV has been relatively flat, indicating a balance between buying and selling pressure.
- Chaikin Money Flow (CMF): The CMF has been positive, suggesting a net inflow of money into the stock.
Key Observation: Volume indicators point towards a neutral sentiment with a slight bullish bias.
Conclusion:
Based on the analysis of the technical indicators, the next few days' possible stock price movement for TFJL is likely to be sideways with a slight bullish bias. The trend indicators show a mixed outlook, while momentum indicators suggest a neutral to slightly bearish sentiment. Volatility indicators indicate a period of consolidation, and volume indicators lean towards a neutral sentiment with a slight bullish bias.
Overall, the stock is expected to trade within a narrow range with a potential upside bias. Investors should closely monitor key support and resistance levels for potential breakout opportunities.