Technical Analysis of THD 2024-05-03
Overview:
In analyzing the technical indicators for THD over the last 5 days, we will delve into the trend, momentum, volatility, and volume indicators to provide a comprehensive outlook on the possible stock price movement in the coming days. By examining these key aspects, we aim to offer valuable insights and recommendations for potential investors.
Trend Analysis:
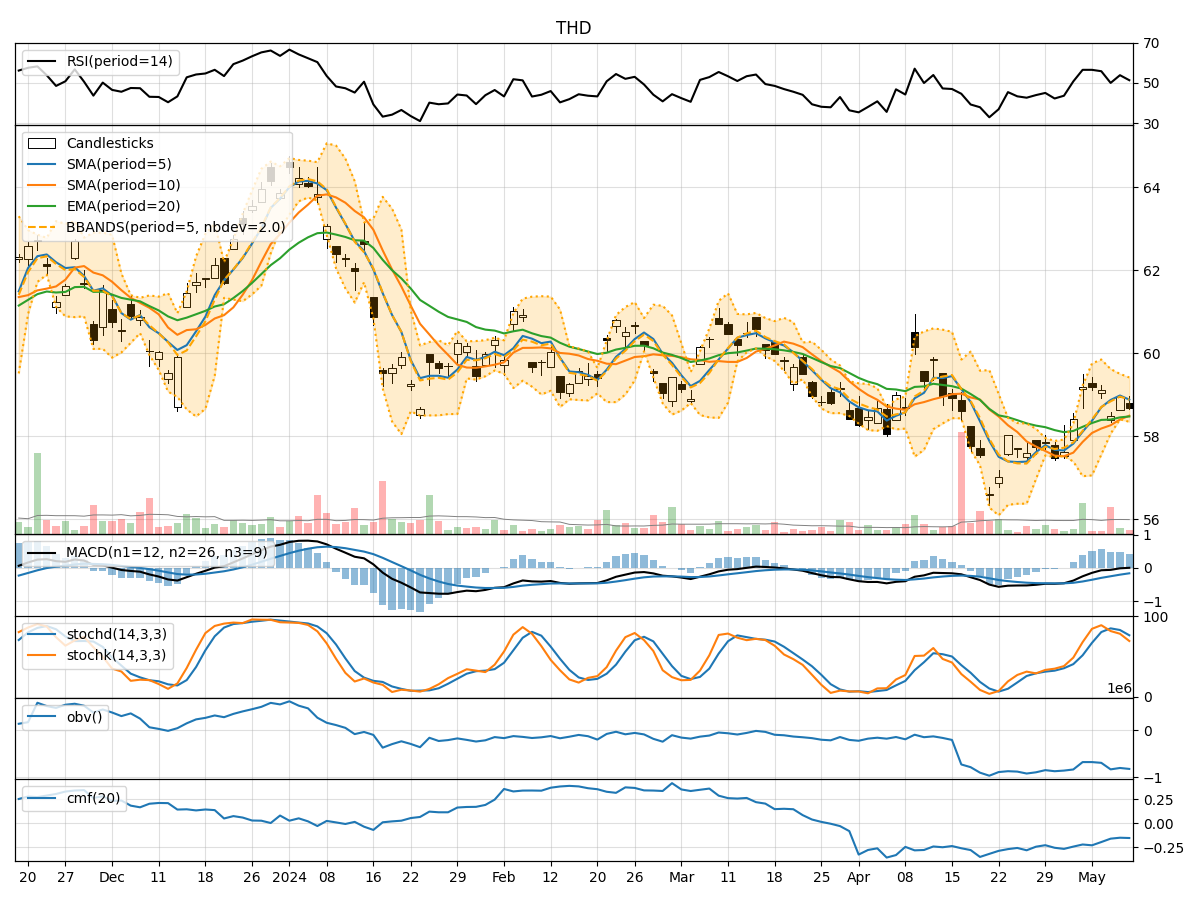
- Moving Averages (MA): The 5-day Moving Average (MA) has been fluctuating around the closing prices, indicating short-term price trends. The Simple Moving Average (SMA) and Exponential Moving Average (EMA) show a slight downward trend, with the EMA lagging behind.
- MACD: The Moving Average Convergence Divergence (MACD) has been negative, but the MACD Histogram is showing signs of improvement, moving towards the zero line.
Momentum Analysis:
- RSI: The Relative Strength Index (RSI) has been gradually increasing, indicating strengthening momentum.
- Stochastic Oscillator: Both %K and %D have been rising, suggesting increasing buying pressure.
- Williams %R: The Williams %R is moving towards the oversold region, indicating a potential buying opportunity.
Volatility Analysis:
- Bollinger Bands (BB): The Bollinger Bands have widened, indicating increased volatility in the stock price.
- Bollinger %B: The %B indicator is below 1, suggesting the stock is trading below the lower Bollinger Band, potentially indicating an oversold condition.
Volume Analysis:
- On-Balance Volume (OBV): The OBV has been declining, indicating a potential distribution phase.
- Chaikin Money Flow (CMF): The CMF has been negative, suggesting outflow of money from the stock.
Key Observations:
- The stock has shown mixed signals in trend indicators, with a slight bearish bias in moving averages.
- Momentum indicators suggest a potential reversal in the short term, with RSI and Stochastic Oscillator showing positive signs.
- Volatility has increased, indicating potential price swings in the coming days.
- Volume indicators point towards a distribution phase, with outflow of money from the stock.
Conclusion:
Based on the analysis of technical indicators, the stock price of THD is likely to experience further downside movement in the short term due to the bearish trend in moving averages and negative volume indicators. However, there are signs of a potential reversal in momentum indicators, which could lead to a temporary bounce back. Traders should exercise caution and consider waiting for more confirmation before making any investment decisions.