Technical Analysis of TIPZ 2024-05-10
Overview:
In analyzing the technical indicators for TIPZ over the last 5 days, we will delve into the trend, momentum, volatility, and volume indicators to provide a comprehensive outlook on the possible stock price movement in the coming days. By examining these key aspects, we aim to offer valuable insights and predictions for informed decision-making.
Trend Analysis:
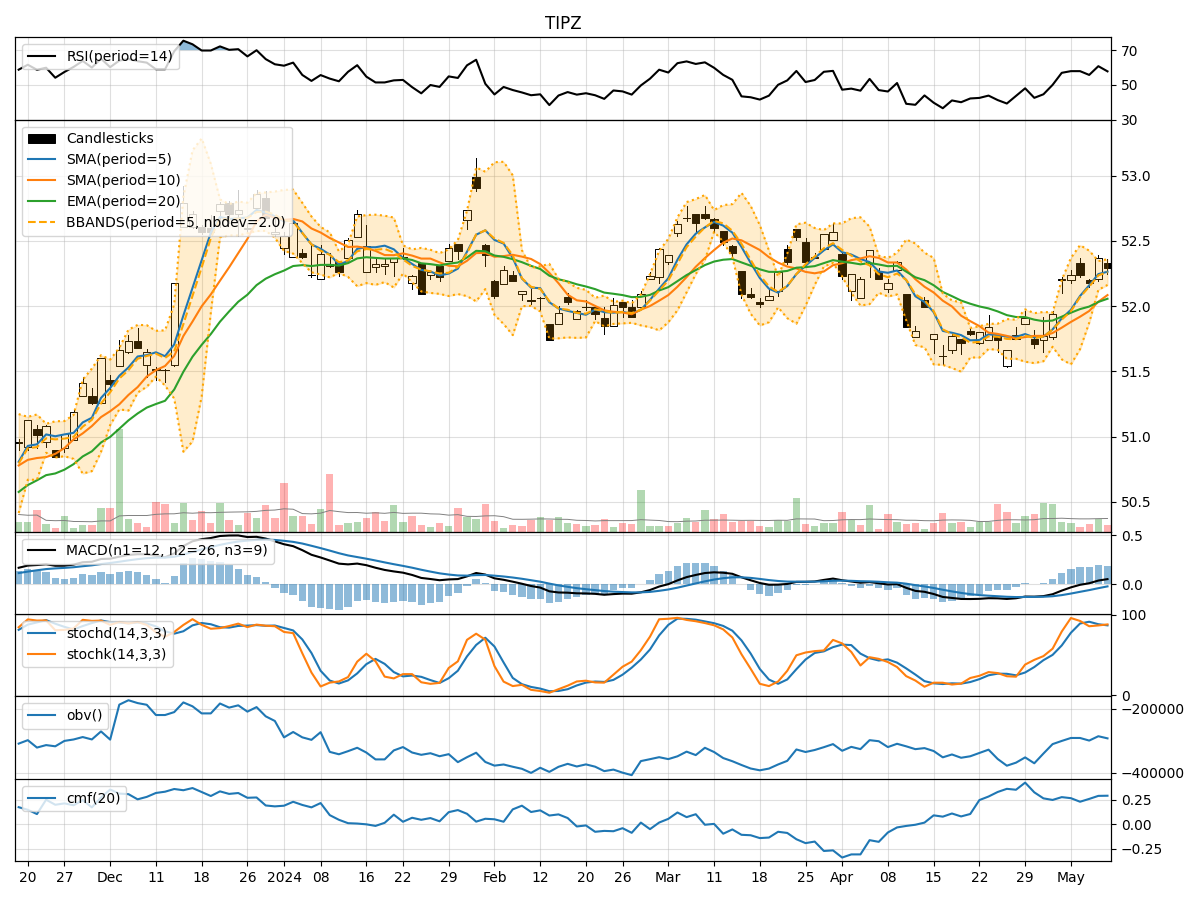
- Moving Averages (MA): The 5-day Moving Average (MA) has been consistently above the Simple Moving Average (SMA) and Exponential Moving Average (EMA), indicating a bullish trend.
- MACD: The MACD line has been consistently above the signal line, with both lines showing an upward trend, suggesting bullish momentum.
Momentum Analysis:
- RSI: The Relative Strength Index (RSI) has been fluctuating around the 60-70 range, indicating a neutral to slightly bullish momentum.
- Stochastic Oscillator: Both %K and %D have been hovering in the overbought territory, suggesting a potential reversal or consolidation phase.
Volatility Analysis:
- Bollinger Bands (BB): The stock price has been trading within the Bollinger Bands, with the bands narrowing, indicating decreasing volatility.
Volume Analysis:
- On-Balance Volume (OBV): The OBV has shown mixed signals, with fluctuations in volume accumulation, reflecting indecision among market participants.
- Chaikin Money Flow (CMF): The CMF has been positive, indicating buying pressure in the market.
Key Observations:
- The trend indicators suggest a bullish sentiment, supported by the MACD and moving averages.
- Momentum indicators show a neutral to slightly bullish stance, with the RSI indicating room for further upside potential.
- Volatility has been decreasing, potentially signaling a period of consolidation or a calm before a potential move.
- Volume indicators reflect mixed signals, with OBV showing indecision but CMF indicating buying pressure.
Conclusion:
Based on the analysis of the technical indicators, the stock price of TIPZ is likely to experience further upward movement in the coming days. The bullish trend, supported by the MACD and moving averages, coupled with the neutral to slightly bullish momentum, suggests a favorable outlook for the stock. While volatility is decreasing, indicating a potential consolidation phase, the overall sentiment remains positive. Traders and investors may consider buying opportunities in anticipation of a continued upward trend.