Technical Analysis of TMF 2024-05-10
Overview:
In analyzing the technical indicators for TMF over the last 5 days, we will delve into the trend, momentum, volatility, and volume indicators to provide a comprehensive outlook on the possible stock price movement in the coming days. By examining these key aspects, we aim to offer valuable insights and recommendations for potential investors.
Trend Analysis:
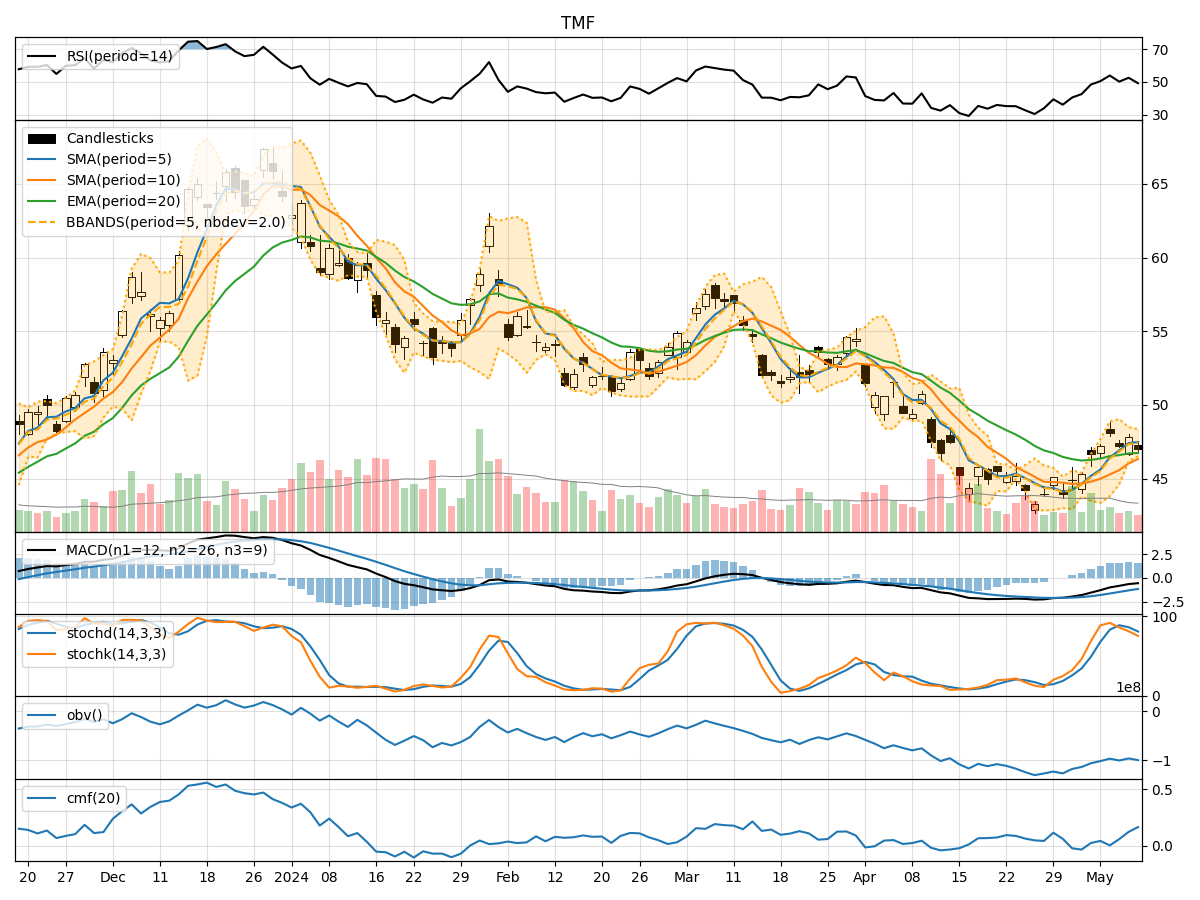
- Moving Averages (MA): The 5-day Moving Average (MA) has been consistently above the Simple Moving Average (SMA) and Exponential Moving Average (EMA), indicating a bullish trend.
- MACD: The MACD line has been consistently above the signal line, suggesting a bullish momentum in the stock price.
- Conclusion: The trend indicators point towards an upward movement in the stock price.
Momentum Analysis:
- RSI: The Relative Strength Index (RSI) has been fluctuating around the 50 level, indicating a neutral momentum.
- Stochastic Oscillator: Both %K and %D have been declining, signaling a potential reversal in momentum.
- Conclusion: The momentum indicators suggest a sideways movement in the stock price.
Volatility Analysis:
- Bollinger Bands (BB): The stock price has been trading within the Bollinger Bands, with the %B indicator showing fluctuations within the bands.
- Conclusion: The volatility indicators imply a consolidation phase in the stock price.
Volume Analysis:
- On-Balance Volume (OBV): The OBV has been fluctuating, indicating indecision among investors.
- Chaikin Money Flow (CMF): The CMF has been gradually increasing, suggesting buying pressure.
- Conclusion: The volume indicators reflect a mixed sentiment among investors.
Conclusion:
Based on the analysis of trend, momentum, volatility, and volume indicators, the overall outlook for TMF stock price in the next few days is as follows: - Trend: Upward - Momentum: Sideways - Volatility: Consolidation - Volume: Mixed
Final Recommendation:
Considering the bullish trend and consolidation in volatility, investors may consider buying TMF stock in the short term. However, the mixed momentum and volume signals indicate a need for caution. It is advisable to closely monitor the stock price movement and set appropriate stop-loss levels to manage risk effectively.